 This is an archive version of the document. To get the most up-to-date information, see the current version.
Virtual Machine Analysis Dashboards
The Virtual Machine Analysis dashboards can be launched in context of Virtual Machine. The following Virtual Machine Analysis dashboards are available:
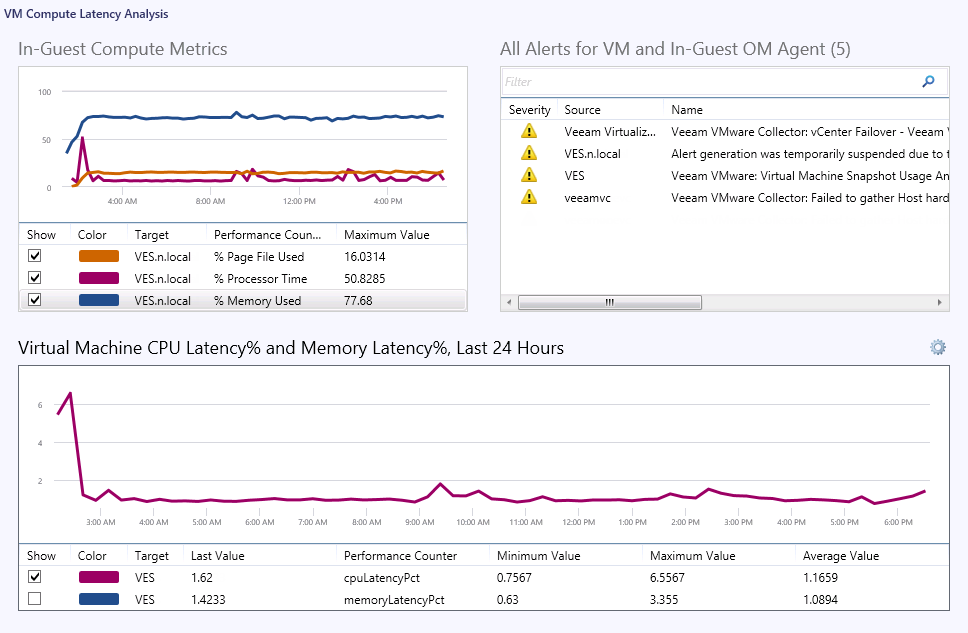
VM Compute Latency Analysis
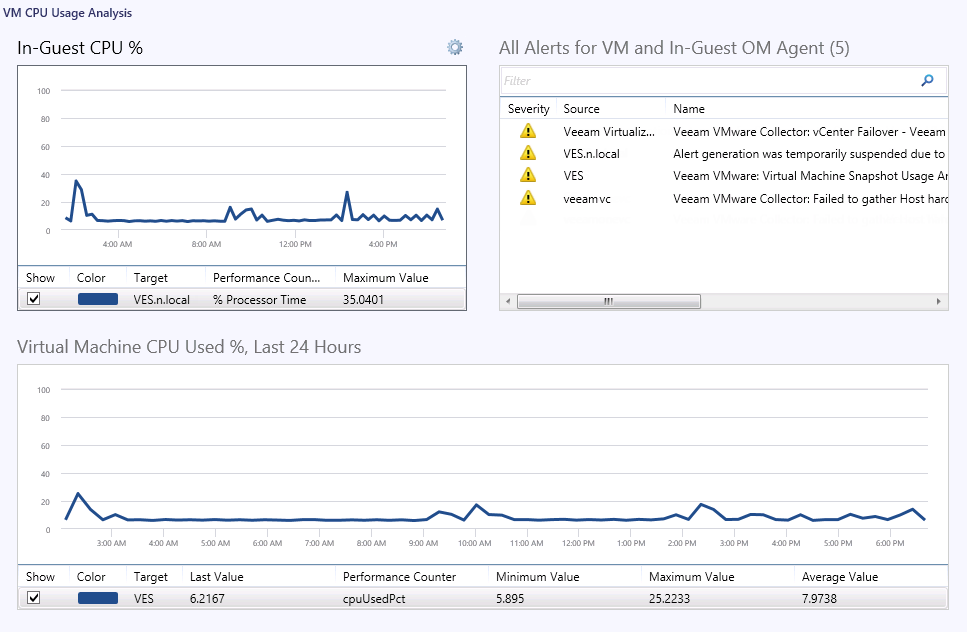
VM CPU Usage Analysis
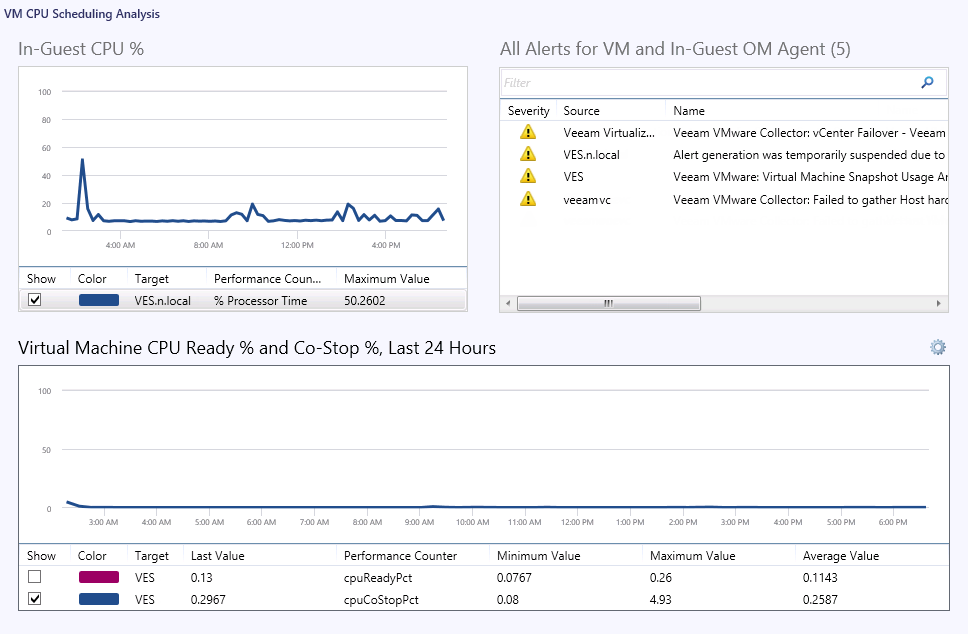
VM CPU Scheduling Analysis
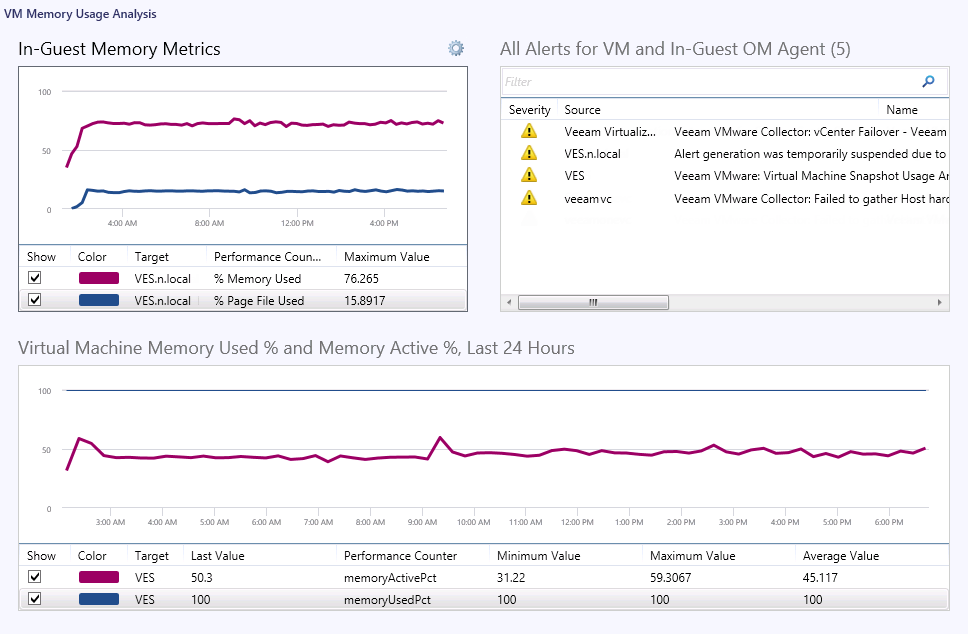
VM Memory Usage Analysis
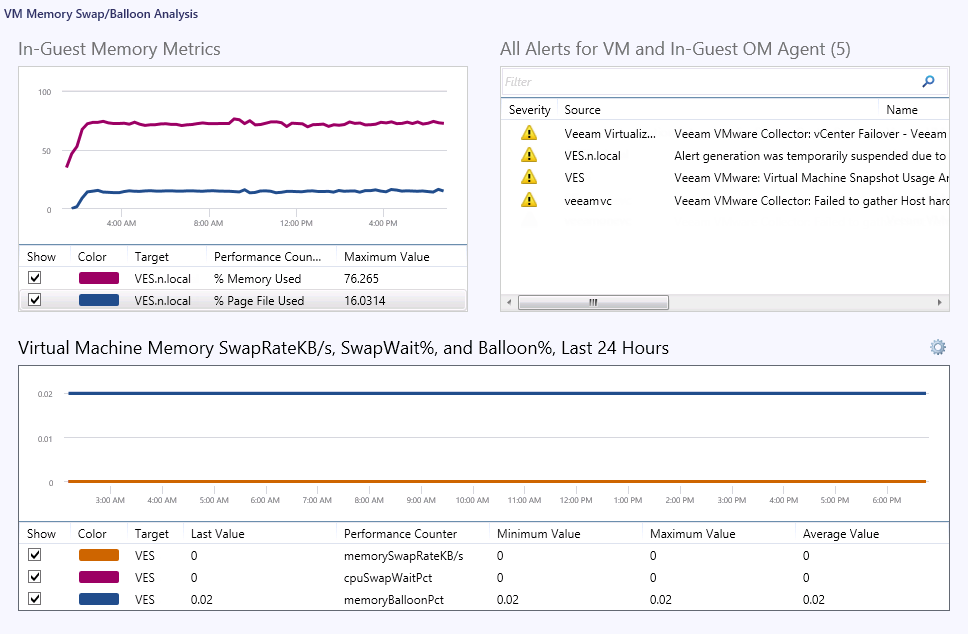
VM Memory Swap/Balloon Analysis
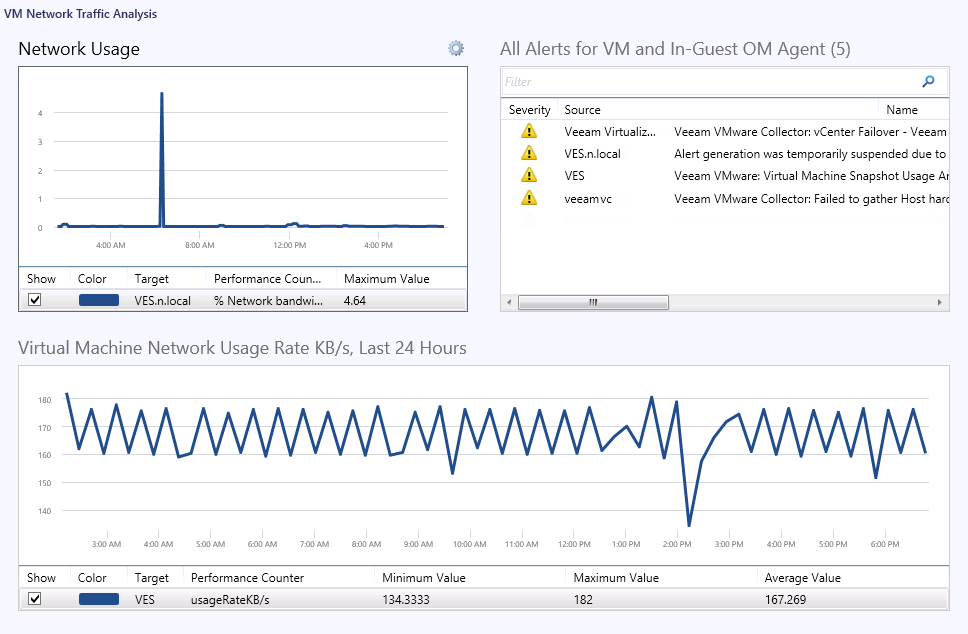
VM Network Traffic Analysis
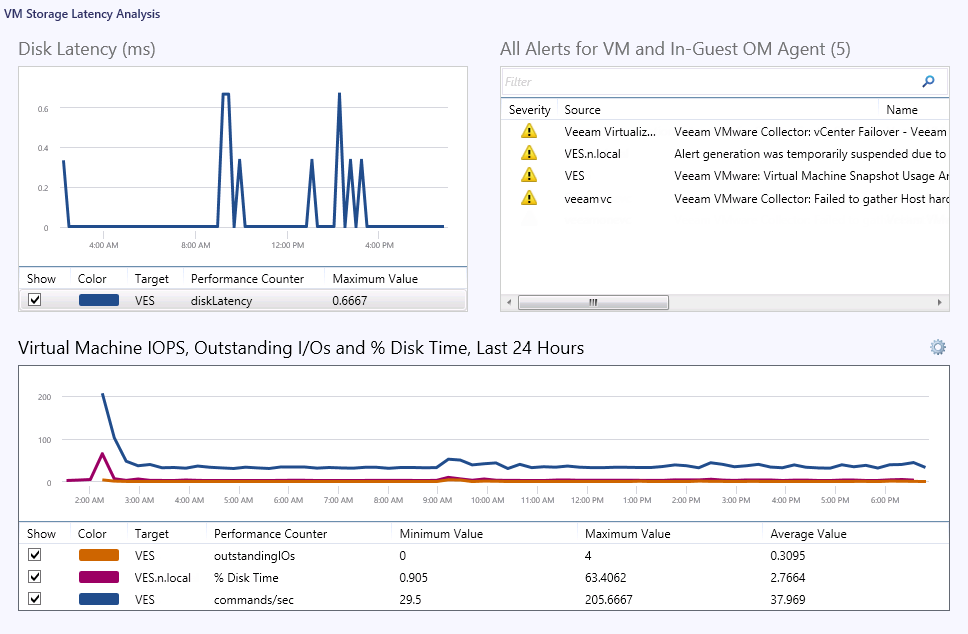
VM Storage Latency Analysis
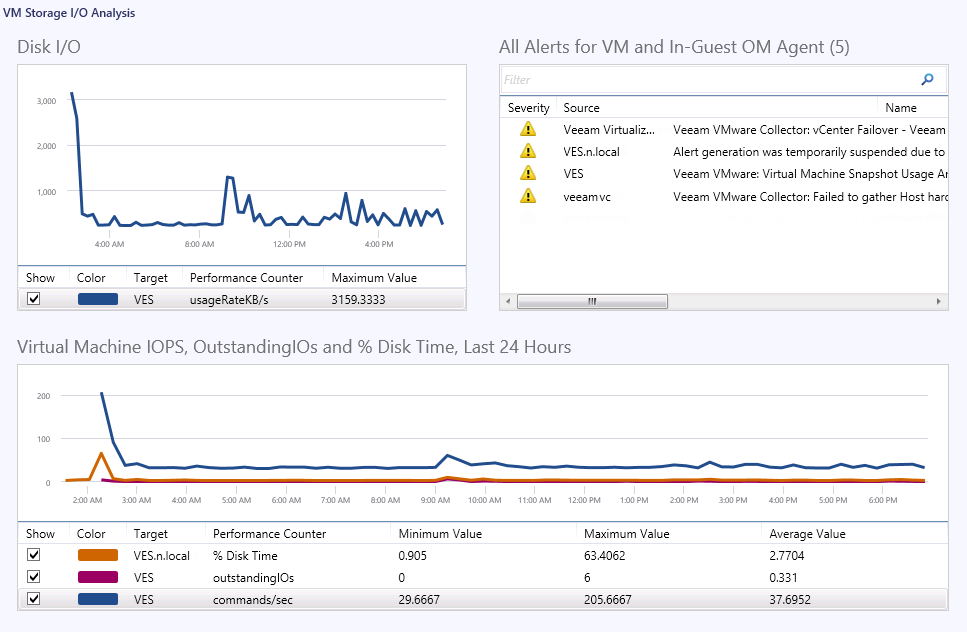
VM Storage I/O Analysis
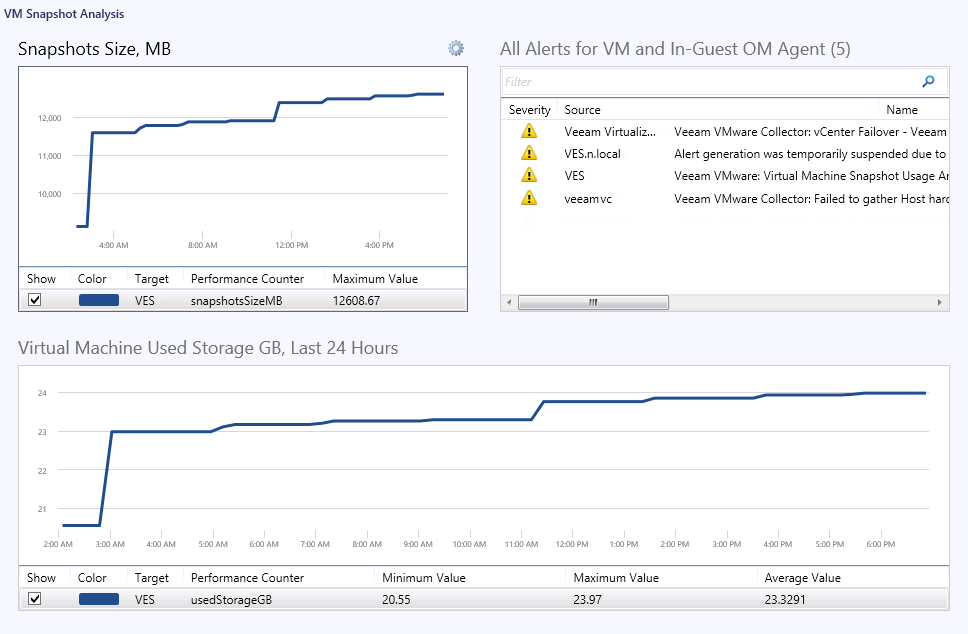
VM Snapshot Analysis
|
For the Analysis Dashboards scoped at Virtual Machine, the performance chart in the upper left pane may display one or more of the following metrics collected using the in-guest Ops Mgr agent, if present. |
Object | Counter |
VMGuest-cpu | % Processor Time |
VMGuest-memory | % Memory Used |
VMGuest-memory | % Page File Used |
VMGuest-memory | Pages/sec |
VMGuest-net | % Bandwidth Used |
VMGuest-disk | % Disk Time |
If the Ops Mgr agent is not deployed inside the virtualized OS, then these metrics will not be available and the upper left pane in the dashboard may be empty.
