 This is an archive version of the document. To get the most up-to-date information, see the current version.
Step 6. Review Veeam Collectors Tab
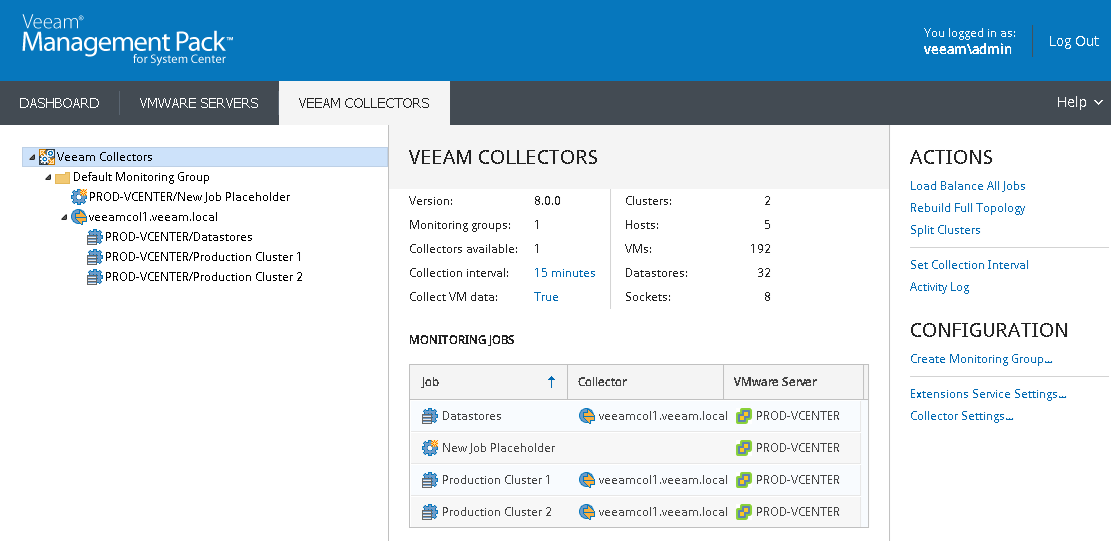
On the Veeam Collectors tab, the tree of the Veeam data-collection back-end hierarchy can be expanded to show monitoring group, Collector server, and monitoring jobs. Selecting nodes in the tree will display information in the details pane. Configuration and Action task links are shown in the pane on the right.
With the root Veeam Collectors node selected, the details pane displays the version of the Veeam Management Pack installed and totals for statistics such as monitoring groups, Collectors, clusters, hosts and so on. Global settings for Collection Interval (15 minutes) and Collect VM Data ('True') are also shown. The Monitoring Jobs table shows all jobs for the entire environment, the Collector they are assigned to, and the vCenter Server target.
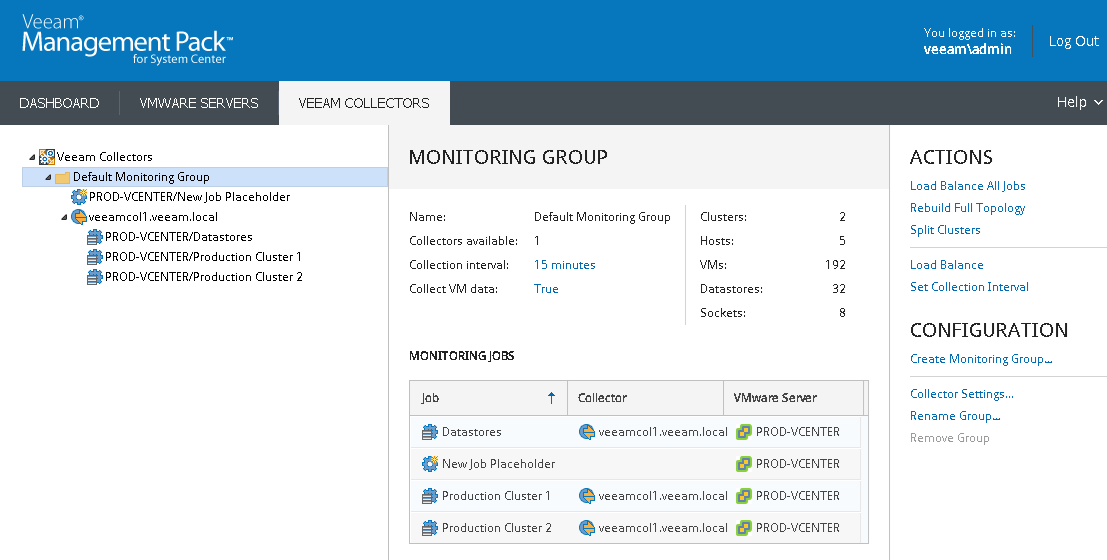
With the Default Monitoring Group node selected, the same monitoring jobs and settings information will be shown, since there is only one Collector and one monitoring group in this example.
|
To add high-availability/load-balanced monitoring to this configuration, it is only necessary to install a second Collector service on another server. The VE Service will monitor heartbeat of all Collectors and automatically fail over jobs if one Collector fails. As many Collectors can be installed as are required for the monitoring load and your high-availability requirements. To learn how to add another Collector, see section Collector-Only Installation. |