Step 6. Review Veeam Collectors Tab
On the Veeam Collectors tab, expand the Veeam Collectors tree to get information on existing monitoring groups, connected Collector servers and available monitoring jobs.
The details pane will display information depending on the selected node. Configuration and Action sections on the right will display all related configuration tasks and actions.
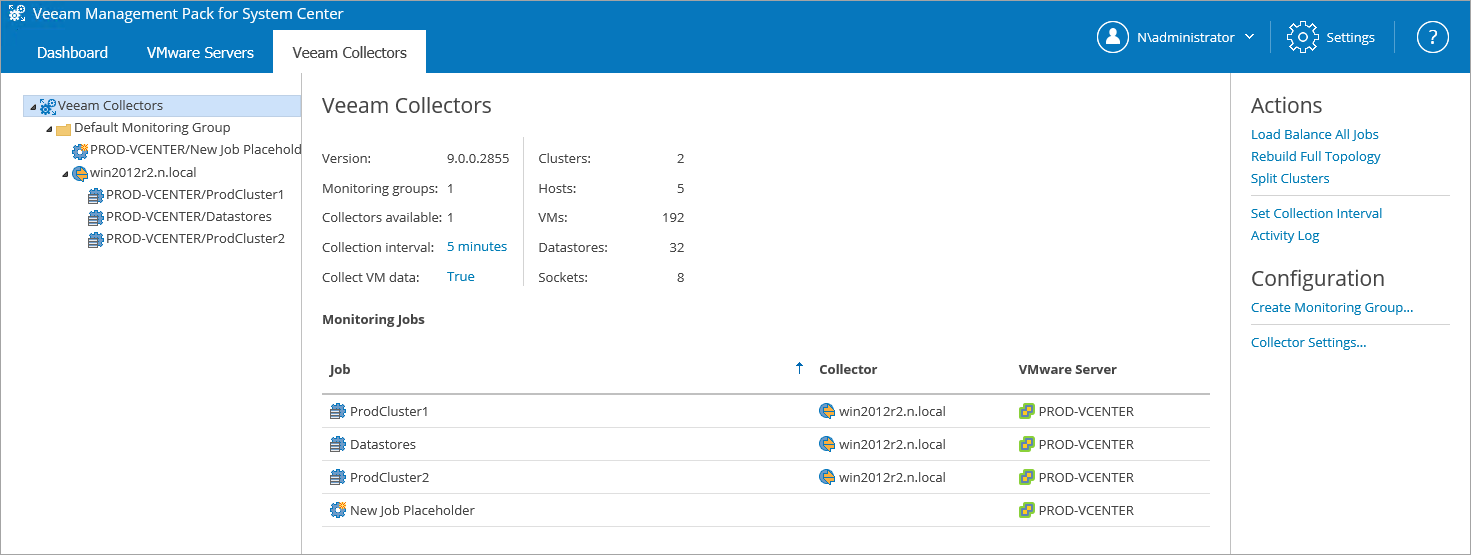
With the root Veeam Collectors node selected, the details pane displays the version of the Veeam Management Pack installed and statistics for monitoring groups, Collectors, clusters, hosts and so on. Global settings for Collection Interval (5 minutes) and Collect VM Data (True) are also shown. The Monitoring Jobs table shows all jobs for the entire environment, the Collector they are assigned to, and the vCenter Server target.
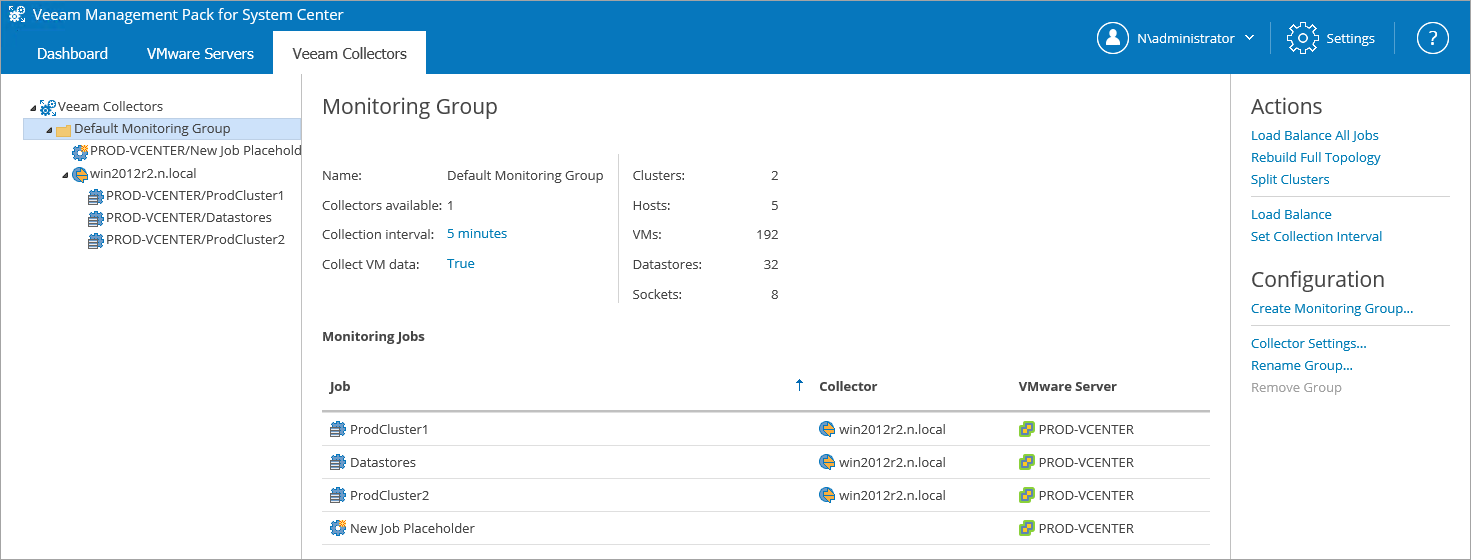
With the Default Monitoring Group node selected, the same monitoring jobs and settings information will be shown, since there is only one Collector and one monitoring group in this example.
Note |
To add high-availability and load-balanced monitoring to this configuration, you must install a second Collector service on another Management server. The VE Service will monitor heartbeat of all Collectors and automatically redistribute jobs if any of the Collectors fail. You can deploy as many Collectors as required for the monitoring load and your high-availability requirements. For information on how to deploy additional Collectors, see Collector-Only Installation. |