Capacity Planning Dashboards
Capacity planning dashboards allow you to forecast the resource utilization for VMware infrastructure objects. To calculate future performance values, Veeam MP analyzes historical performance data for the specified period in the past, calculates the performance utilization trend and applies this trend to the forecast horizon.
Note |
Capacity Planning dashboards, as with Capacity Planning reports, require an Enterprise Plus license for Veeam MP |
There are 2 heatmap dashboards available in the root Veeam for VMware folder:
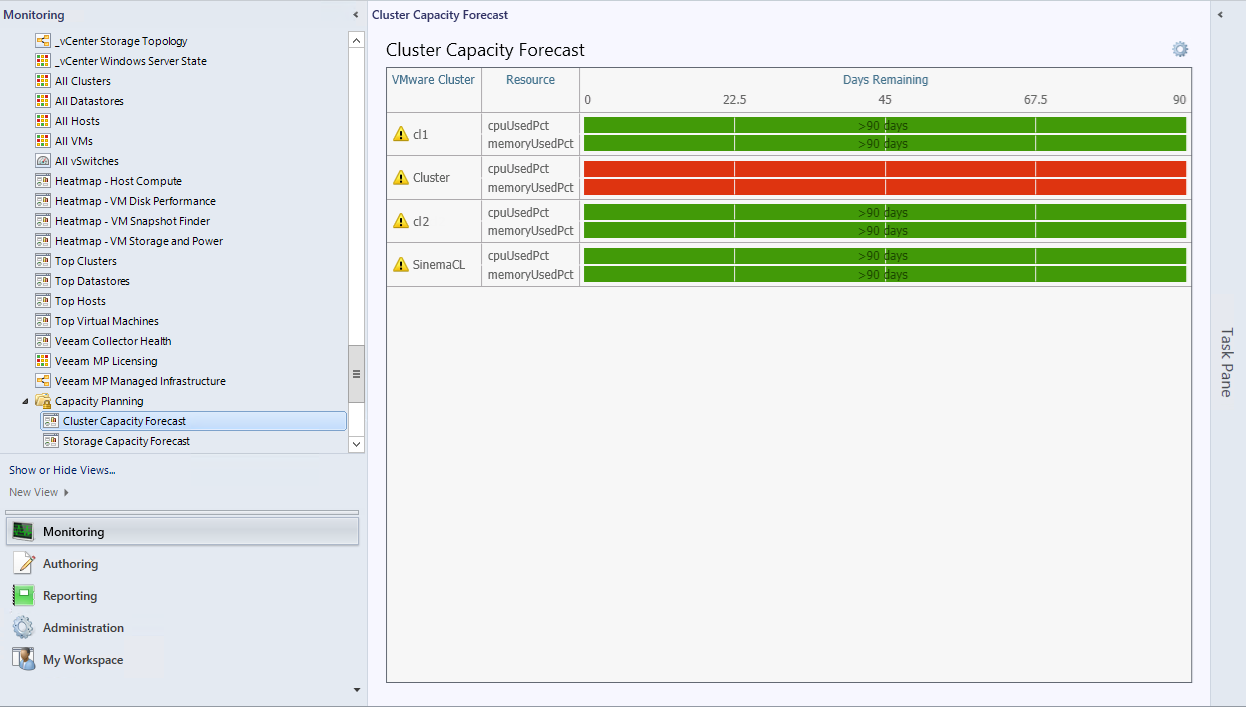
- Cluster Capacity Forecast — forecasts how many days remain before the level of CPU and memory utilization in a vSphere cluster reaches the specified threshold values.
- Storage Capacity Forecast — forecasts how many days remain before the level of space usage in a datastore reaches the specified threshold values.
Example screenshot below shows the forecast on the number of days left before the level of CPU and memory usage in clusters reaches 85%:
The default configuration of the capacity planning widgets can be customized. For details on changing widget settings, see section Personalizing Veeam Dashboard Widgets.