Step 9. Review Veeam Collectors Tab
On the Veeam Collectors tab, the tree of the Veeam data-collection back-end hierarchy can be expanded to show monitoring group, Collector server, and monitoring jobs as shown. Selecting nodes in the tree view will display information in the details pane. Configuration and Action task links are shown in the pane on the right.
With the root Veeam Collectors node selected, the details pane displays the version of the Veeam Management Pack installed and totals for statistics such as monitoring groups, Collectors, clusters, hosts and so on. The Monitoring Jobs table shows all jobs for the entire environment, with the Collector they are assigned to, and the vCenter Server target.
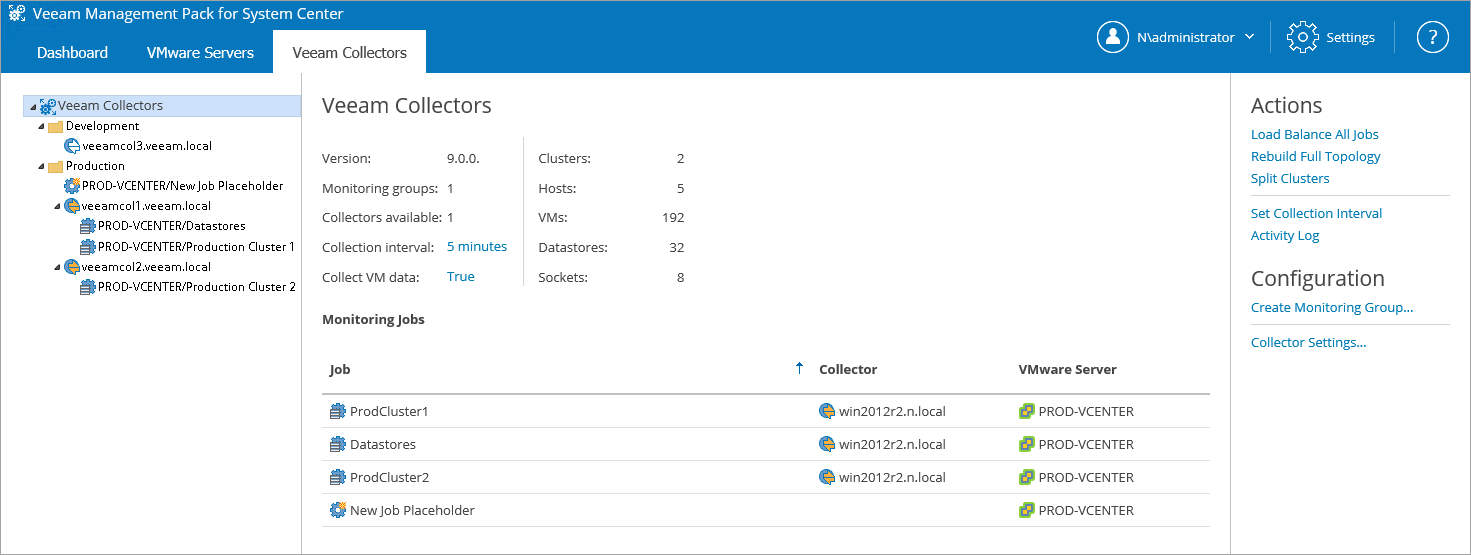
In this example, with 2 Collectors available in the Production monitoring group, the Virtualization Extensions Service has automatically load-balanced the jobs across the VEEAMCOL1 and VEEAMCOL2 Collectors. Because the third VEEAMCOL3 Collector is in a separate monitoring group, (Development) it did not participate in the load-balancing and is still Inactive, with no jobs.
Selecting the Production monitoring group will show the status and object counts for this group.
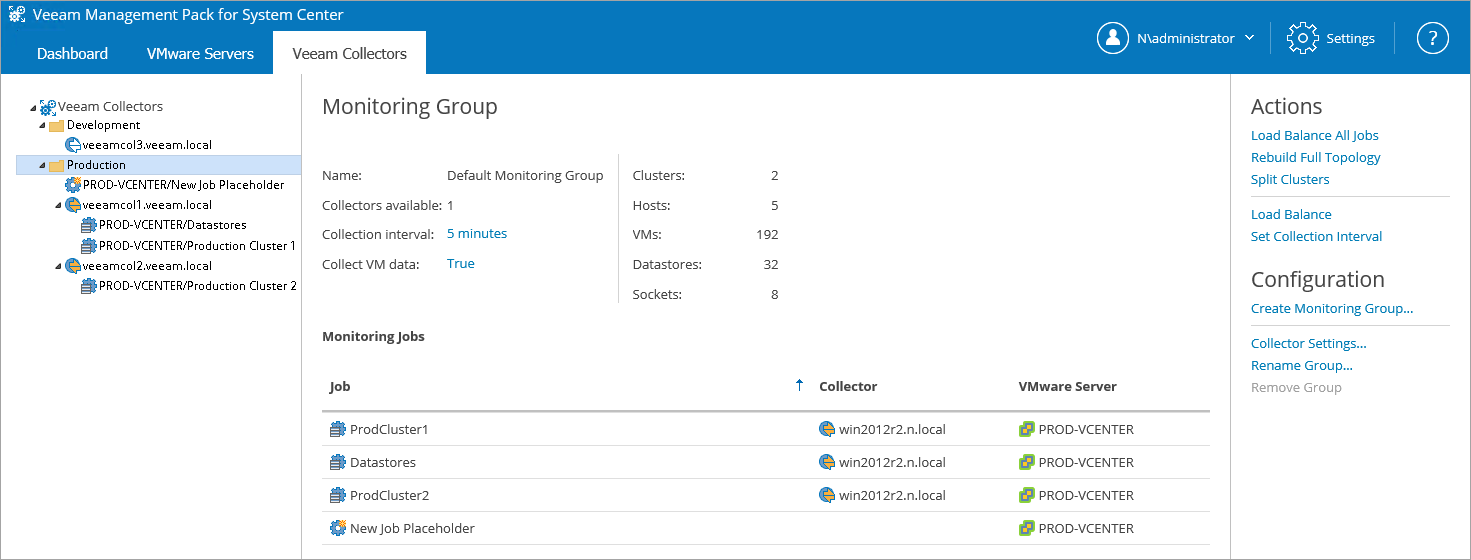
The Monitoring Jobs table will also show job names, the Collector they are assigned to, and the vCenter Server target name.