Infrastructure Summary
Native tools that are a part of the VMware vSphere virtualization platform do not provide complete infrastructure visibility. This report reveals the necessary VMware inventory configuration specifics and allows you to evaluate current resource utilization in your VMware infrastructure.
Example Output
In this example, the report allows you to collect data on resource usage and configuration of your virtual environment for the previous month.
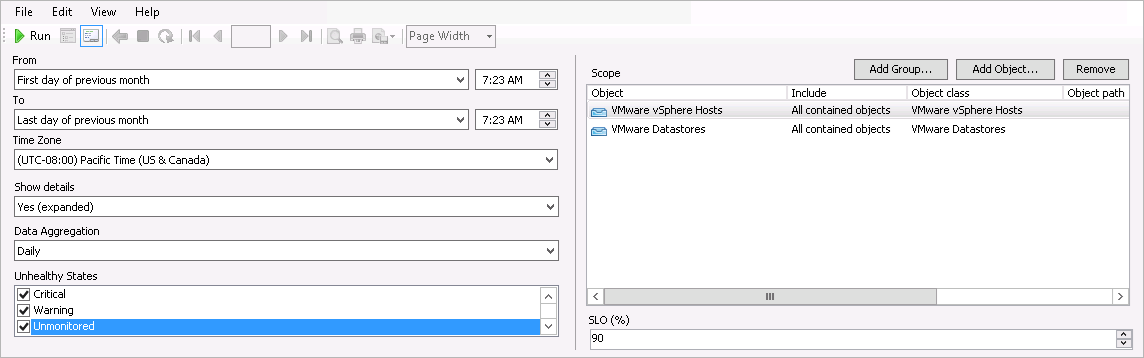
To run this report:
- From the From list, select Previous month > First day. From the To list, select Previous month > Last day.
- From the Show details list, select Yes (expanded).
- From the Unhealthy States list, select Critical, Warning and Unmonitored.
- Leave the Scope section without changes.
- In the SLO (%) field, enter 85.
- Click Run to view the report.
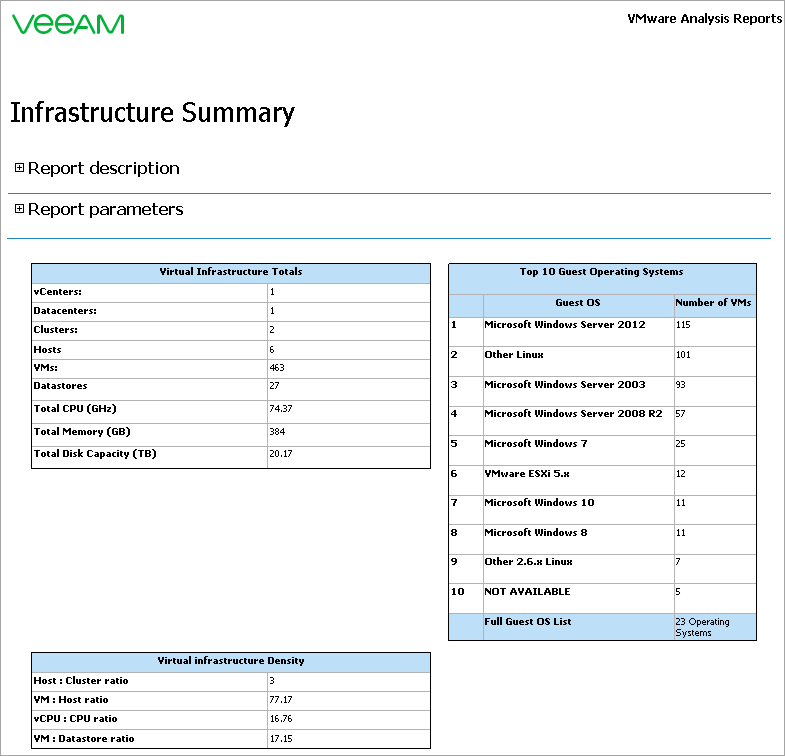
The report will provide summary information on the selected infrastructure scope: the total number of vCenter Servers, datacenters, clusters, hosts, VMs and datastores, as well as total CPU, memory and disk resources.
The Virtual Infrastructure Density table will show the following consolidation ratios:
- Host : Cluster ratio — the average number of hosts in a cluster;
- VM : Host ratio — the average number of VMs running on a host;
- vCPU : CPU ratio — the average number of vCPUs configured for a single physical processor;
- VM : Datastore ratio — the average number of VMs on a datastore.
The Top 10 Guest Operating Systems table will show a list of guest operating systems installed on VMs in your environment.
Details tables will display configuration properties of vCenter Servers, datastores, clusters and host systems. For each datastore, the report will also provide information on its capacity and the amount of provisioned, used and free space.
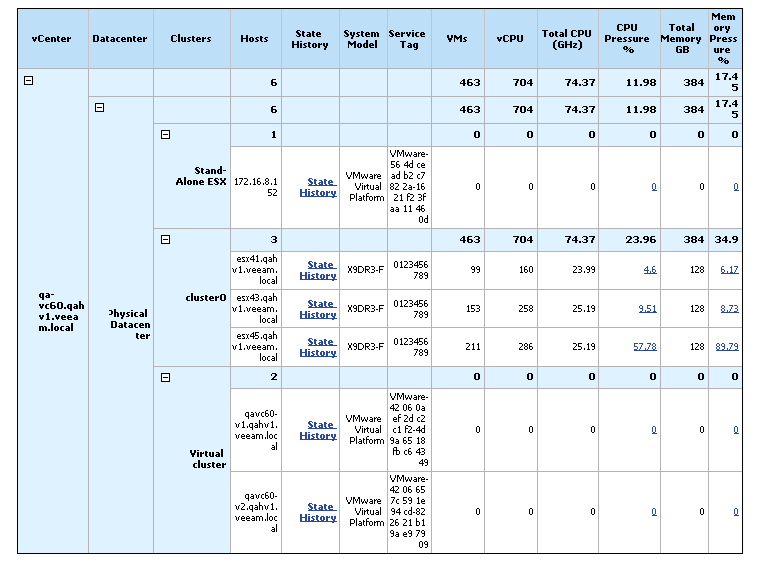
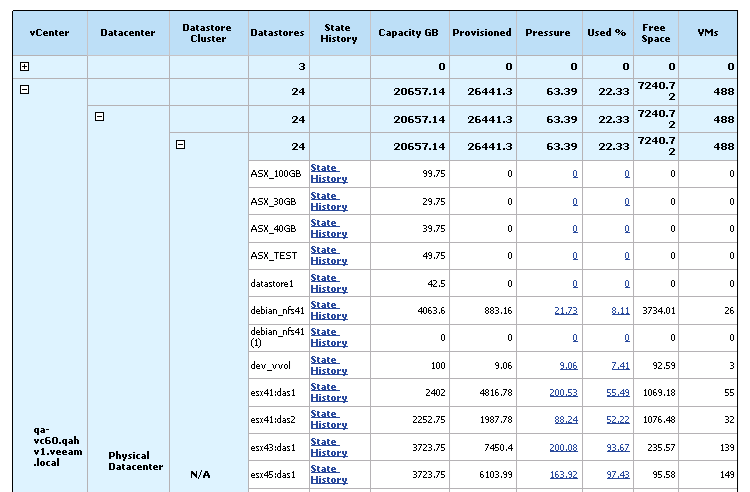
You can click the State History link in a details table to drill down to the Veeam State Summary Report and review uptime and downtime statistics for the infrastructure object. For more information on the Veeam State Summary Report, see Veeam Report Library Help.
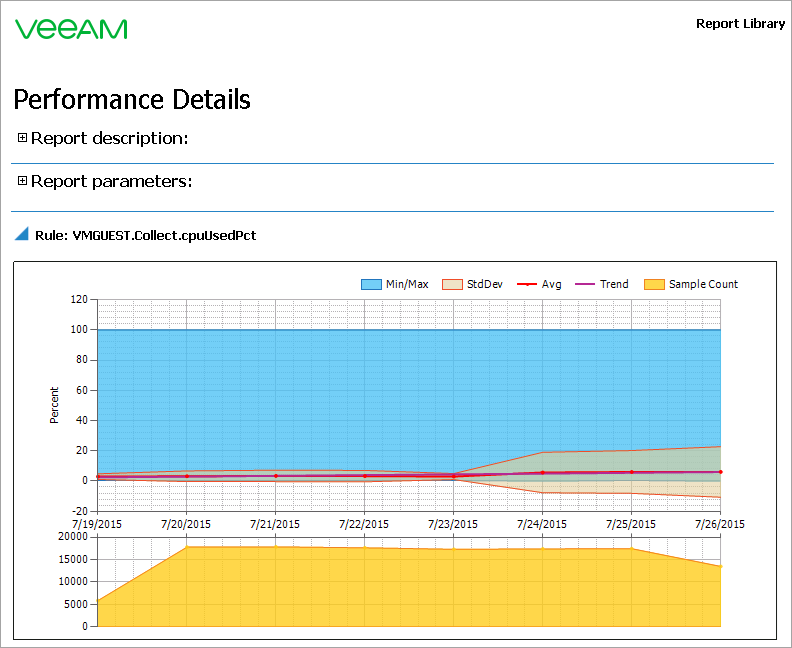
You can click a number in the CPU Usage %, Memory Pressure %, Memory Usage %, Pressure or VMs column of a details table to drill down to performance details for the infrastructure object.