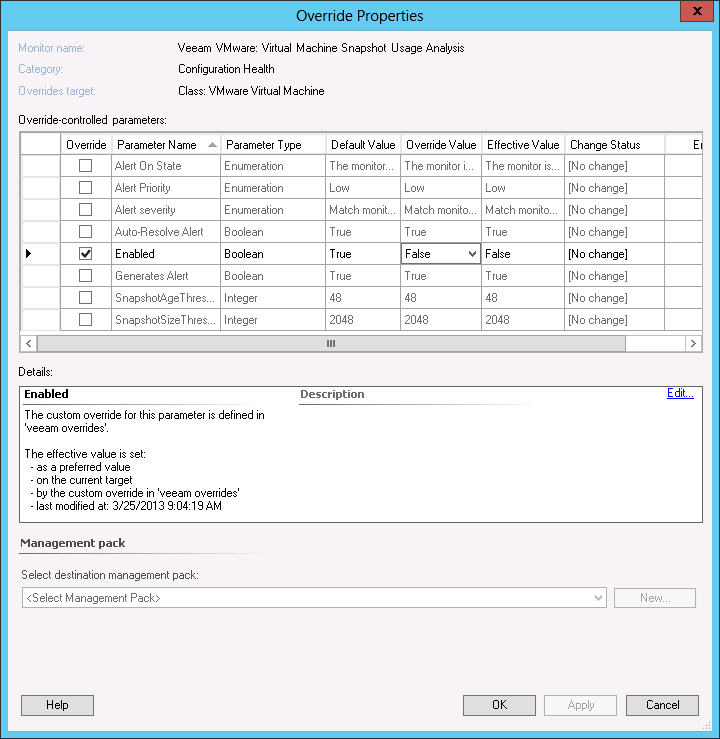
Overriding a Veeam Analysis Monitor with Multiple Metric Inputs
Standard OpsMgr methods for customizing rules and monitors can be used with Veeam MP for VMware. All thresholds can be modified using overrides, created in the OpsMgr console in the usual way.
The example chosen here is Analysis Monitor Veeam VMware: Virtual Machine Snapshot Usage Analysis. This monitor analyzes two VMware metrics:
- Snapshot Age (of oldest snapshot, in hours)
- Snapshot Size (total for all snapshots, in MB)
The monitor will produce different state and alert description output depending on which metrics have breached the threshold.
Monitor configuration can be accessed in the standard OpsMgr fashion. Either:
- Right-click the Monitor in the Health Explorer view and select Properties.
- Click the Alert Monitor link in the Alert details pane of the _All Active Alerts view.
- Search in the OpsMgr console Authoring pane (select Management Pack Objects > Monitors; in the Look For box, search for ‘veeam’; right-click the monitor under target ‘VMware Virtual Machine’).
From the Monitor Properties dialog, Overrides tab, click the Overrides button and choose your desired scope, for example ‘for all objects of class: VMware Virtual Machine’ to make the override global.
Configure your required override parameters from the dialog. Note the multiple metrics and thresholds available:
- SnapshotAgeThreshold
- SnapshotSizeThreshold
Choose a Management Pack to store your overrides in (Microsoft Best Practice dictates a dedicated Overrides MP for each sealed MP), and click OK.
The monitor operates as follows:
- The monitor will raise an alert if any metric breaches threshold.
- The alert description is dynamically generated depending on which metrics have breached threshold. Description also contains additional related data and troubleshooting hints.
Sample alert description output from this monitor is shown below:
Alert Description |
The virtual machine akvHVDEV1 running on host esx-prod1.veeam.local is using snapshot(s). |
