Host Failure Modeling
This report allows you both to simulate a failure of one or more hosts in a vSphere cluster, and forecast to how many days remain before the level of CPU and memory usage in the cluster reaches the specified threshold values. Based on the forecasted resource usage, the report provides recommendations on appropriate resource allocation, which can help prevent possible CPU and memory resource shortfalls in future.
Example Output
The report can be scoped at one or more vSphere clusters in your environment. In this example, the report helps reveal whether a cluster will be able to sustain the current workload within the next 30 days (without exceeding 80% threshold of CPU and memory usage) in case 1 host in the cluster accidentally fails.
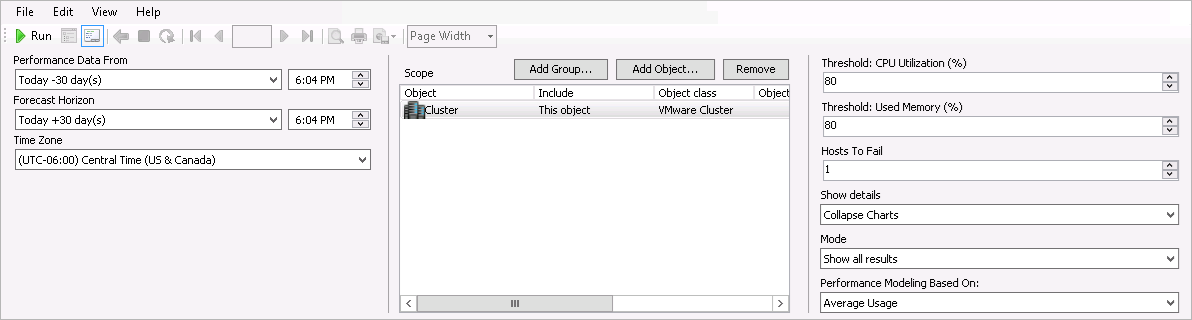
To run this report:
- From the Performance Data From list, select a day that dates back 30 days from now.
- From the Forecast Horizon list, select a date 30 days from today to define the forecast period.
- In the Scope section, choose the cluster for which you want to model a host failure.
- In the Threshold: CPU Usage (%) and Threshold: Used Memory (%) fields, type 80.
- In the Hosts to Fail field, enter 1.
- From the Show details list, select Collapse Charts.
- From the Mode list, select Show all results.
- From the Performance Modeling Based On list, select Average Usage.
- Click Run to view the report.
The report will use historical performance data for the previous 30 days to analyze the CPU and memory utilization trend in the cluster. Next, it will apply the calculated performance trend to the forecast horizon and will detail how much CPU and memory resources will be available in future if one host in the cluster fails.
The Virtual Infrastructure Described table will provide an overview of the cluster included in the report scope: number of hosts, number of VMs (total, active, shutdown and suspended) and total CPU and memory usage values.
The Performance Forecast Analysis and Recommendations table will provide details and recommendations for the resource which utilization threshold will be breached first within the forecast period.
The Overall Recommendations table will provide recommendations for the cluster included in the report scope.
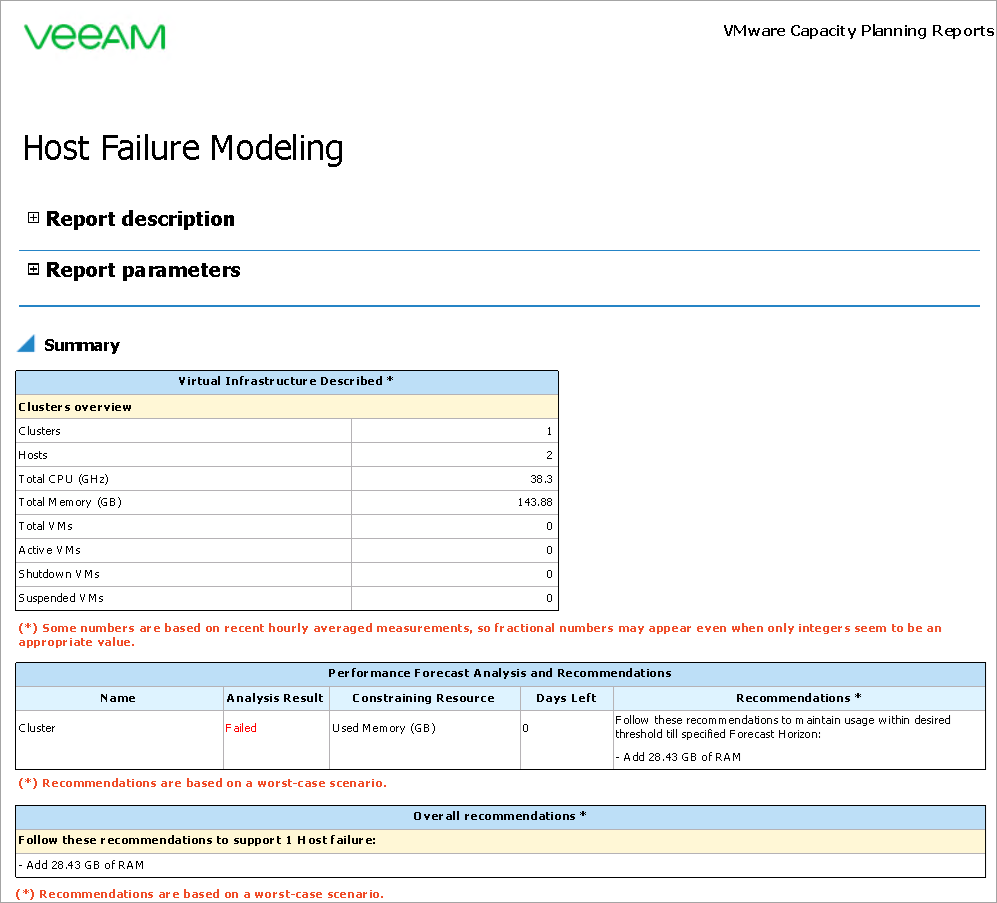
In this example, the cluster is reported to run out of memory if one of the hosts fails. The number of Days Left shows 0, which means that the cluster will not be able to sustain the current workload. The Recommendation section provides practical recommendations for maintaining the resource usage within the desired threshold.
Further report details provide in-depth forecast information for the cluster.
The doughnut charts will represent the number of removed and remaining hosts and amount of removed and remaining resources in the simulated scenario.
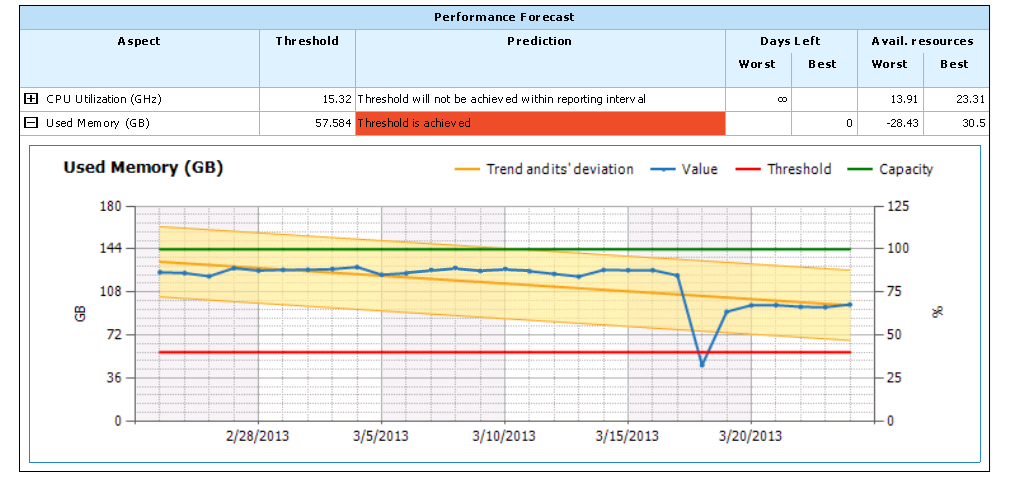
The Performance Forecast table reveals whether the specified thresholds will be breached and details the following forecasted values (all values are provided for both the best-case and the worst-case scenarios):
- Days Left: number of days after which CPU and memory utilization thresholds will be breached
- Available resources: amount of resources that will remain unused on the forecast horizon date (available resources, calculated as the difference between the threshold and the predicted resource usage)

In this example, the report provides the following forecasts:
- Memory usage threshold will be breached immediately after the host failure.
- CPU utilization threshold will not be breached both in the worst-case and best-case scenarios.
You can expand the table rows to open charts detailing actual CPU and memory utilization values, calculated utilization trend and its deviation, resource capacity and the threshold.