Appendix K. Creating Ops Mgr Monitors for Custom vCenter Server Alarms
You may encounter a situation where you have a custom alarm configured in your vCenter Server and you want to capture its states in the OpsMgr console. In this case you will need to create an OpsMgr unit monitor that will use Veeam MP event logs for collecting necessary events. You can then track alerts generated by the monitor in object-related Veeam MP alert views.
The example below describes how to create a monitor that tracks health states for all Host objects in your virtual infrastructure and generates alerts when the states change:
- In the OpsMgr console, switch to the Authoring pane and navigate to Management Pack Objects> Monitors > Create a Monitor > Unit Monitor.
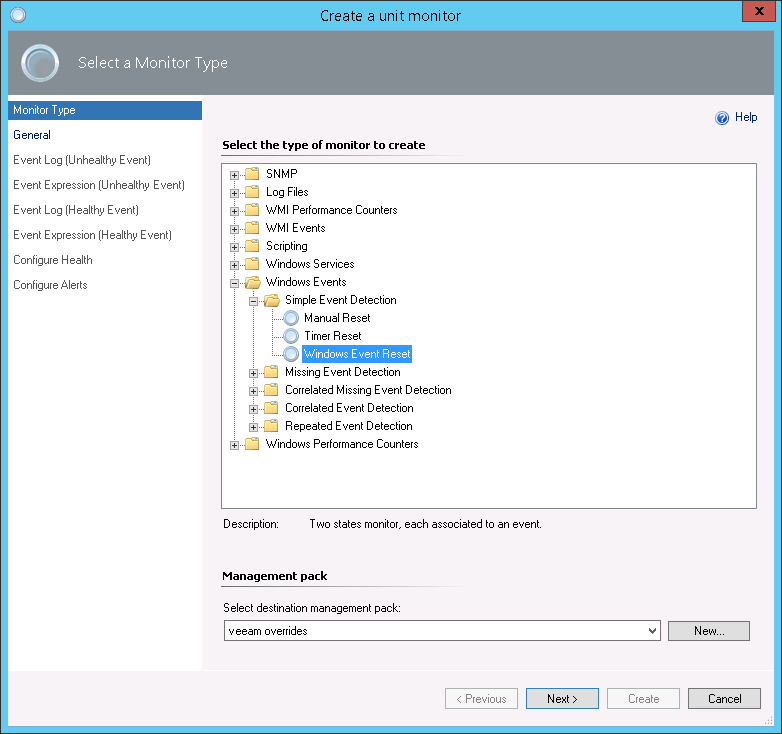
- At the Monitor Type page, choose Windows Events\ Simple Event Detection\ Windows Event Reset.
From the Management pack list, select a destination management pack for the newly created monitor.
- At the General page, in the Name field, enter a name for the monitor.
- If you want Veeam MP views to capture alerts generated by the monitor, make sure that the monitor and alert names start with “Veeam VMware:”.
To make host-related views capture alerts generated by the monitor, the name must start with “Veeam VMware: Host”.
- In the Description field, provide description for the monitor. Note that it will not be displayed in the alert text.
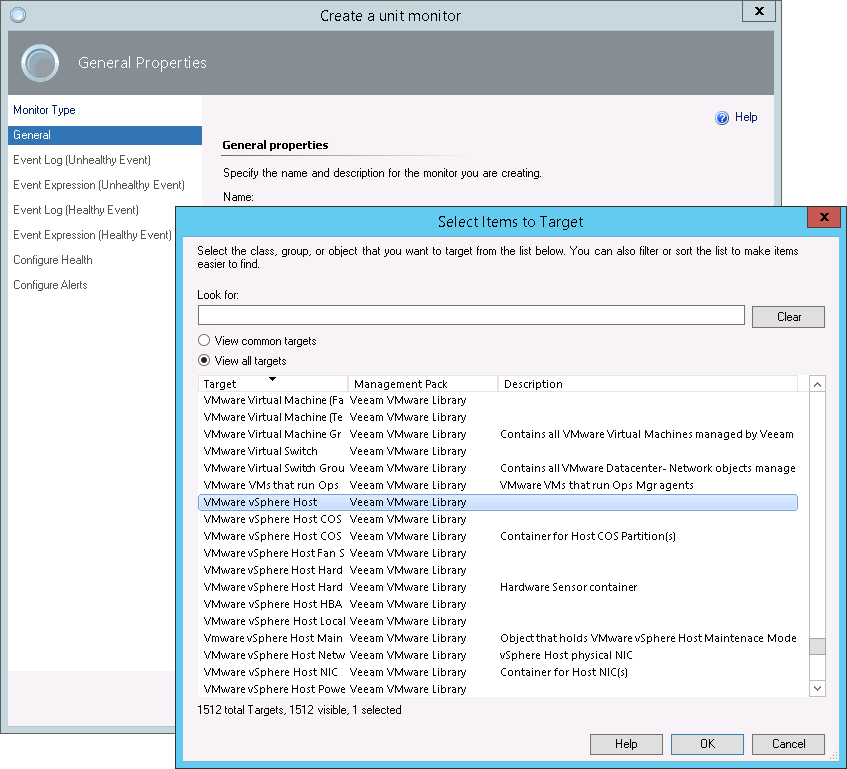
- Click Select next to the Monitor target field. In the Select Items to Target window, select View all targets and choose VMware vSphere Host as a target for the monitor.
- From the Parent monitor list, select Availability.
- If you want to configure overrides for the monitor, you can clear the Monitor is enabled check box and select it later. Otherwise, make sure the check box is selected.
Note |
For other infrastructure objects, use a similar approach. For example, if you want to generate alerts for the vCenter Server objects, select VMware vCenter as a target for the monitor; if you want to generate alerts for the Cluster objects, select VMware Cluster. |
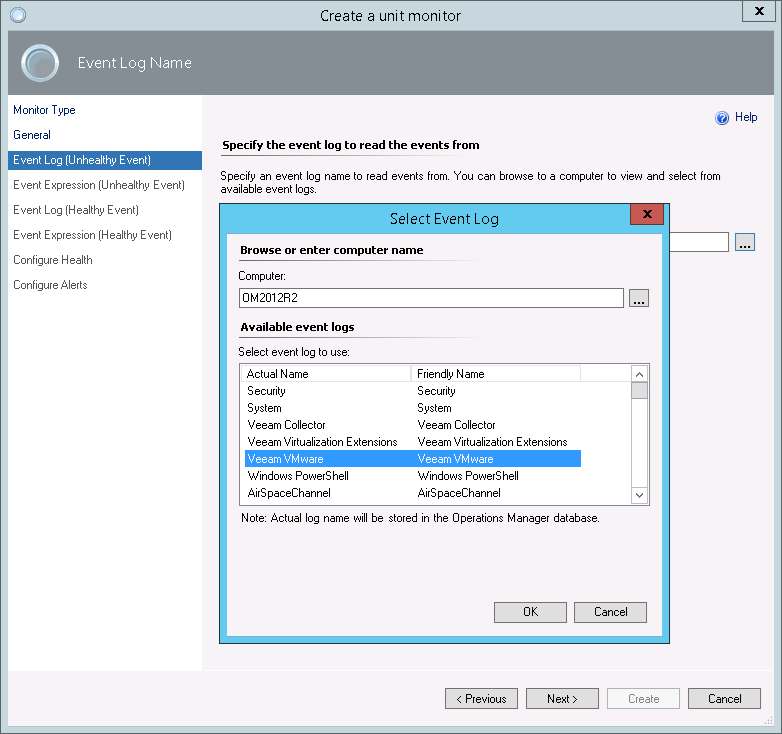
- At the Event Log (Unhealthy Event) page, choose the event log from which the monitor will read events triggered when the alarm enters an unhealthy state.
- Click the button next to the Log name field.
- From the Available event logs list, select Veeam VMware. If this log does not appear in the list, you may need to connect to the VMware Collector.
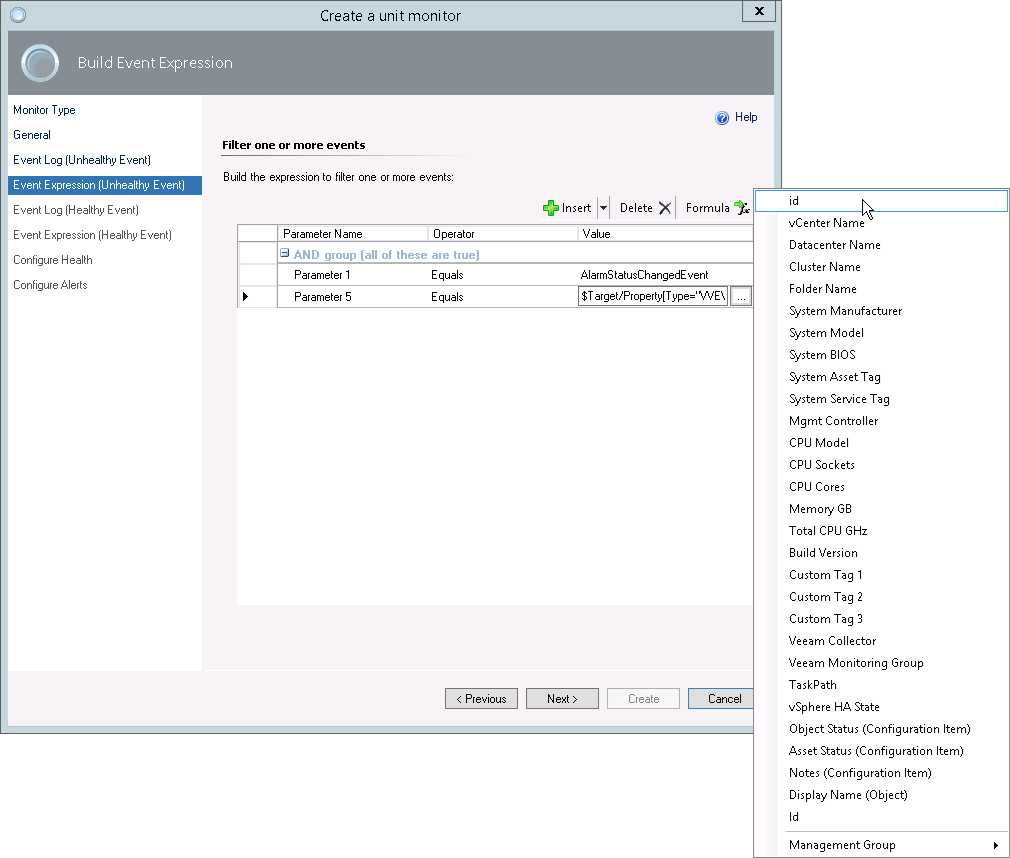
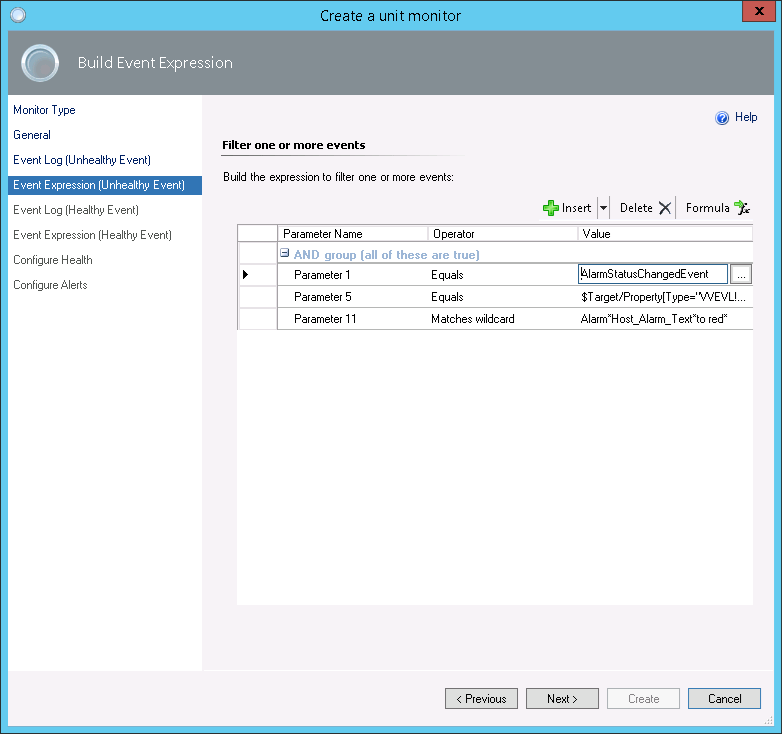
- At the Event Expression (Unhealthy Event) page, change default event properties.
In this example, change the properties as follows:
- Click the button next to the first line in the Parameter Name column. In the Select an Event Property window, select Specify event specific parameter to use and type 1.
From the Operator list, select Equals.
In the Value field, type AlarmStatusChangedEvent.
- Click the button next to the second line in the Parameter Name column. In the Select an Event Property window, select Specify event specific parameter to use and type 5.
From the Operator list, select Equals.
In the Value field, select the id property.
- Click Insert. Click the button next to the third line in the Parameter Name column. In the Select an Event Property window, select Specify event specific parameter to use and type 11.
From the Operator list, select Matches wildcard.
In the Value field, type Alarm*NAME_OF_THE_ALARM*to red*, where:
- NAME_OF_THE ALARM must be changed to the name of the alarm you want to capture.
- Red (Critical state) can be changed to yellow in case you want to track the Warning state.
Notes |
If you want to create a monitor with the vCenter Server target, you must add Parameter 6 and assign the Display Name (object) value to it. If you want to create a monitor with the Cluster target, you must add Parameter 4 and assign the Display Name (object) value to it. If you want to create a monitor with the Datacenter target, you must add Parameter 3 and assign the Display Name (object) value to it. If you want to create a monitor with the Virtual Machine target, you must add Parameter 8 and assign the Id value to it. |
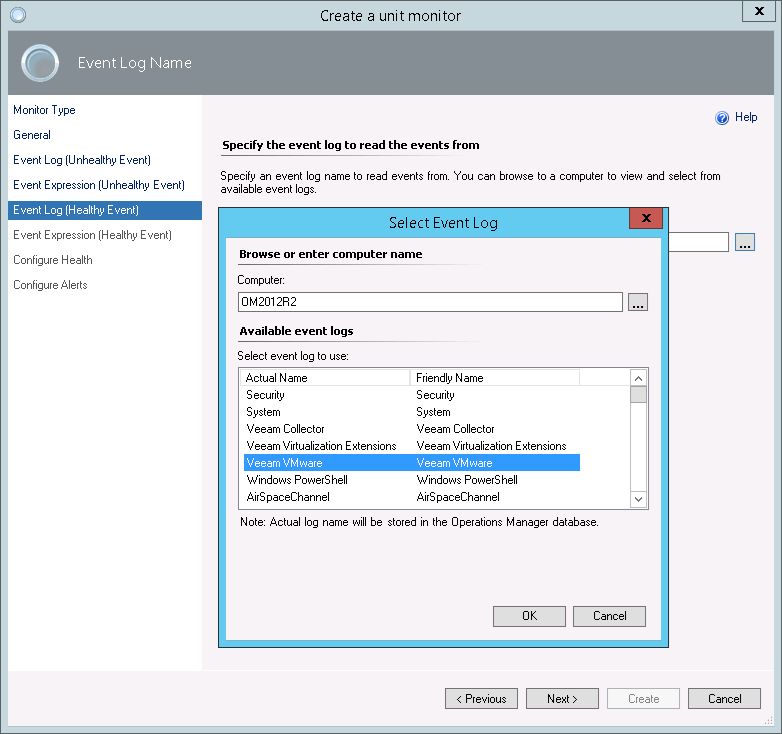
- At the Event Log (Healthy Event) page, choose the event log from which the monitor will read events triggered when the alarm enters the healthy state.
- Click the button next to the Log name field.
- From the Available event logs list, select Veeam VMware.
- At the Event Expression (Healthy Event) page, repeat the procedure described at step 5, but at this time the Parameter 11 value must be Alarm*NAME_OF_THE_ALARM*to green* to track the Healthy state.

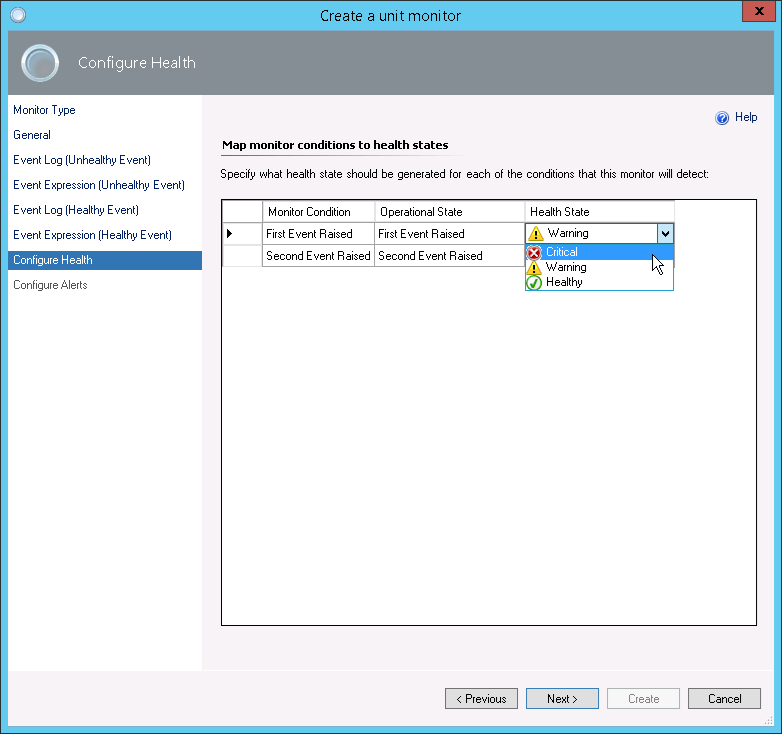
- At the Configure Health page, select health states that the monitor will change when one of the conditions specified above is met.
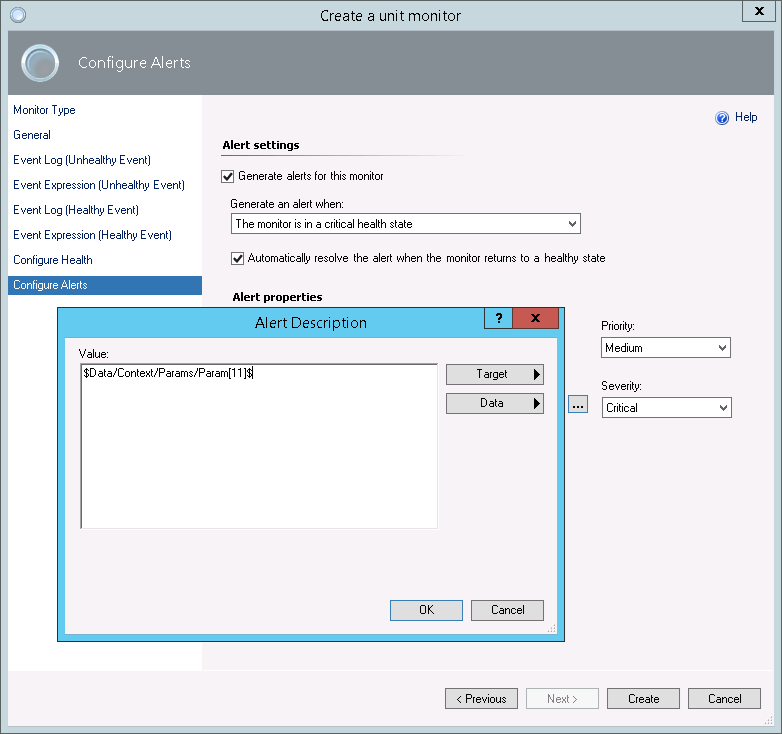
- At the Configure Alerts page:
- Select the Generate alerts for this monitor check box.
- From the Generate an alert when drop-down list, select The monitor is in a critical health state.
- Make sure that the Automatically resolve the alert when the monitor returns to a healthy state check box is selected.
- Choose alert priority and severity.
- Enter a dynamically populated description for the AlarmStatusChangedEvent specified at step 5.
Click the button next to the Alert description field. In the Alert Description window, specify the following value: $Data/Context/Params/Param[11]$
- Click Create to create the monitor.