Storage Performance Profile Analysis
This report analyzes storage IOPS and latency statistics across a time range. The report helps you track whether the latency threshold is exceeded within the reporting period, and shows the IOPS achieved during latency peaks. The report analyzes IOPS and latency statistics for datastores, shows correlation between the IOPS and latency metrics and helps understand the real-world performance of backend storage.
Example Output
In this example, the report allows you to find the most loaded datastores for this month, assuming that the maximum latency has to be lower than 30 milliseconds.
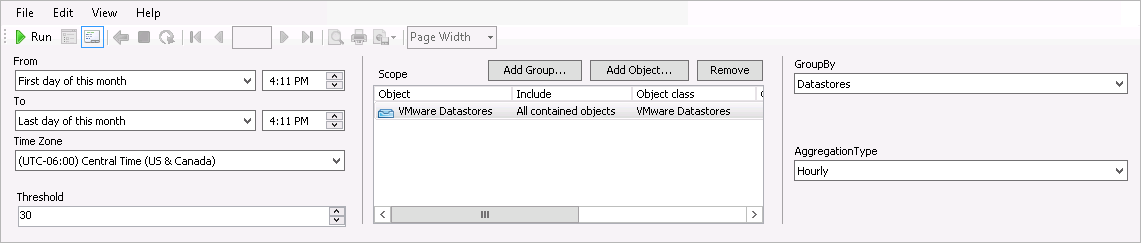
To run this report:
- From the From list, select This month > First day. From the To list, select This month > Last day.
- Leave the Scope section without changes.
- From the Aggregation Type list, select Daily.
- From the Group By list, select Datastores.
- In the Threshold field, enter 30.
- Click Run to view the report.
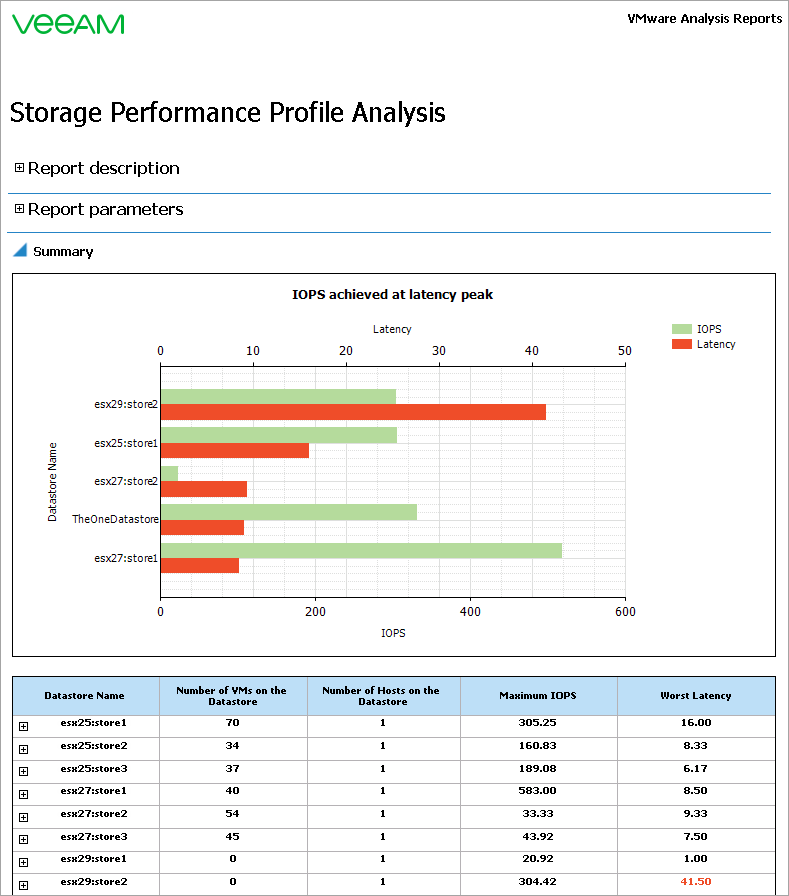
The IOPS achieved at latency peak chart will show 5 most loaded datastores. For each datastore, the chart shows the worst latency value reported within the selected period and the IOPS value that was achieved during this latency peak.
The details table will show the total number of VMs hosted on the datastore, the maximum number of IOPS reported for the selected period and the highest latency value reported for the selected period.
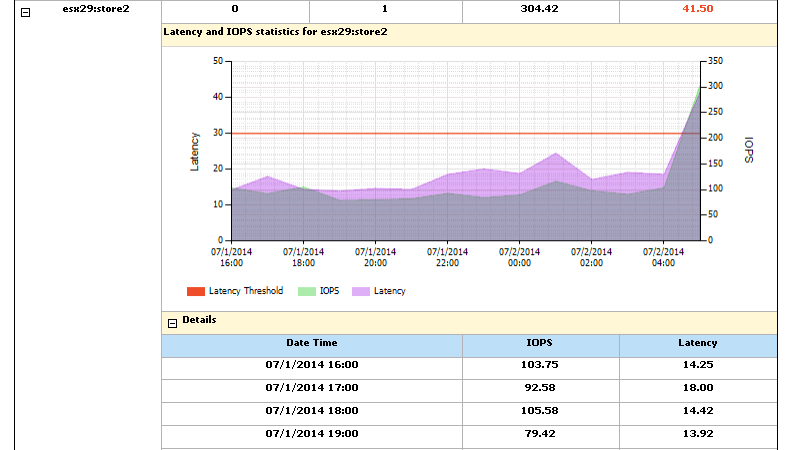
For each datastore, the Latency and IOPS statistics section will provide day-by-day latency and IOPS values and show whether (and when) the defined latency threshold has been breached.