Datastores. Space Usage Heatmap
This report analyzes the amount of space consumed by files of virtual machines on datastores and shows how VM files have grown across a time range.
Example Output
In this example, the report allows you to detect VMs that have grown by over 15 GB during this month.
To run this report:
- From the From list, select This month > First day. From the To list, select Today.
- In the Scope section, include the necessary datastore in the report.
- In the Growth Threshold field, enter 15.
- From the Growth Threshold Unit list, select %.
- In the Cell Capacity (GB) field, enter 10.
- Click Run to view the report.

The report will draw the Heat Map that illustrates how much space every VM consumes on the datastore.
The amount of space consumed by a VM is presented as a colored bar. The bar is comprised of cells, each cell indicates 10 GB (cell capacity) of consumed datastore space.
The bar color depends on the VM growth rate:
- Green: For the reporting period, a VM has grown by less than 15% (that is, consumed less datastore space that defined by the Growth Threshold).
- Red: For the reporting period a VM has grown by over 15% (that is, consumed more datastore space that defined by the Growth Threshold).
- Yellow: All virtual machines whose files consume less than 5 GB (half of a Heat Map cell) are grouped together and do not have individual cells. They are represented with a single yellow bar at the end of the Heat Map.
- White: The amount of unconsumed datastore space is presented as empty cells on the Heat Map.
- Gray: The amount of space consumed by unknown files on the datastore. Unknown files are represented with a single gray bar at the end of the Heat Map
The report table will list all VMs whose files reside on the datastore and show the following metrics for every VM:
- Amount of space consumed by VM files on the datastore
- Amount of space that the VM consumed during this week (reporting period), both in GB and percent.
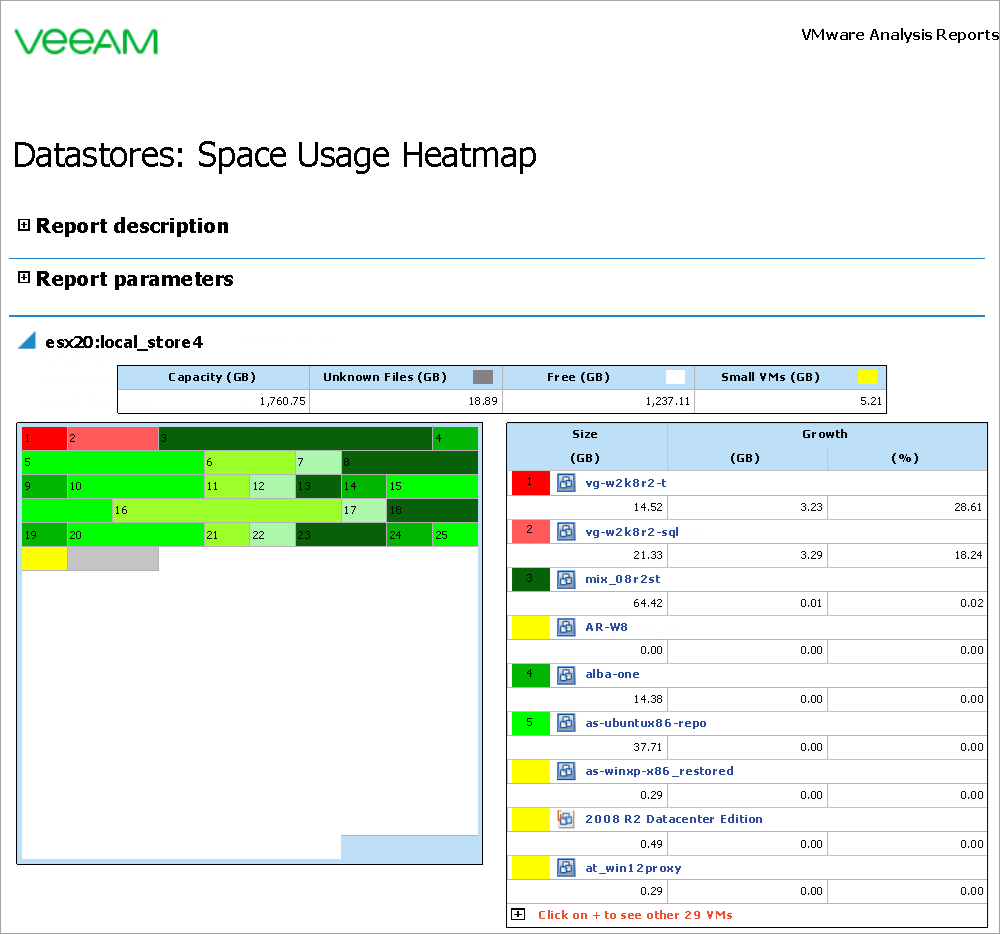
It can be seen from the report output that:
- The datastore size is 1760 GB. Cell Capacity parameter of 10 means the datastore area will take the space of 176 cells.
- VM #1 is colored red, as it has exceeded the 15% growth rate threshold.
- VMs #3 and #16 are the largest, but are not growing faster than the chosen threshold of 15%.
- Free Space is 1230 GB, shown as white space within the datastore area.
- All virtual machines whose files consume less than 5 GB (half of a Heat Map cell) are grouped together and do not have individual cells. They are represented with a single yellow bar.
- There is also an area of ‘unknown’ files, colored gray (possibly ISOs, orphaned VMs, or other files. Run the Datastore Scan Task to see the file list on this datastore).
- Full VM details are given in the table to the right of the heatmap.
You can click a VM name, a datastore name or a cell on the Heat Map to drill down to the Veeam Performance Details Report from the Veeam Report Library.