Example Troubleshooting Scenario
This use example will illustrate troubleshooting an issue with storage latency using the features of Veeam MP for VMware.
Note |
The specific metric values used are for demonstration purposes and may not reflect the real-world situation in your environment. The intent is to show the drill-down and root-cause analytics possible with the Veeam MP for VMware tools. |
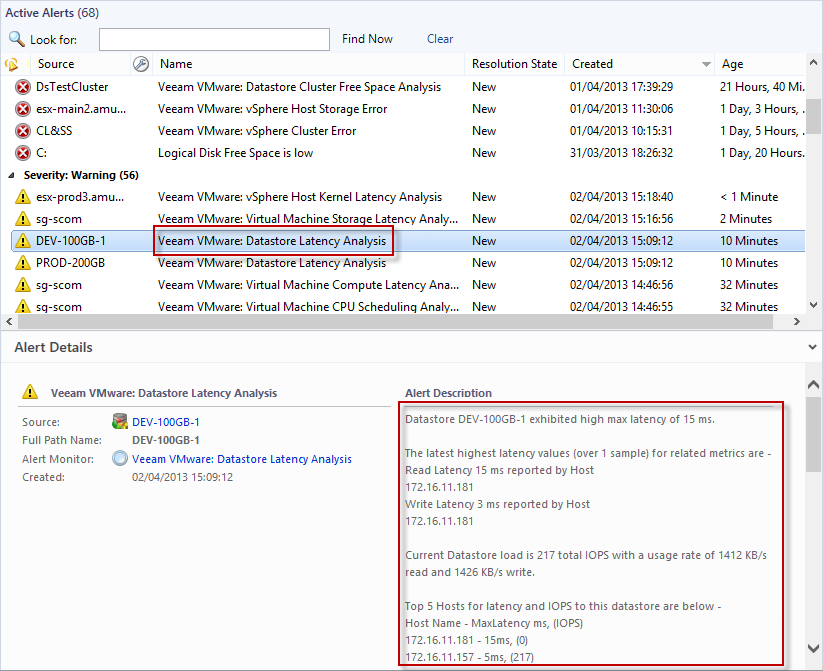
The screenshot below shows a Datastore Latency Analysis monitor alert selected. This datastore is exhibiting high latency (response time, in milliseconds) which has breached the threshold.
Note |
Veeam MP for VMware measures latency in two distinct areas — at the datastore layer (device latency) and at the vSphere host level (kernel latency). |
The Veeam MP for VMware Datastore Latency Analysis monitor has pulled in related data to assist in troubleshooting. The Alert description contains detail on which hosts reported highest latency, and of which type (read / write). The breakdown of current load on the datastore in IOPS and in KB/s is provided. And the ‘Top N’ hosts reporting latency, with their I/O load, is also given.
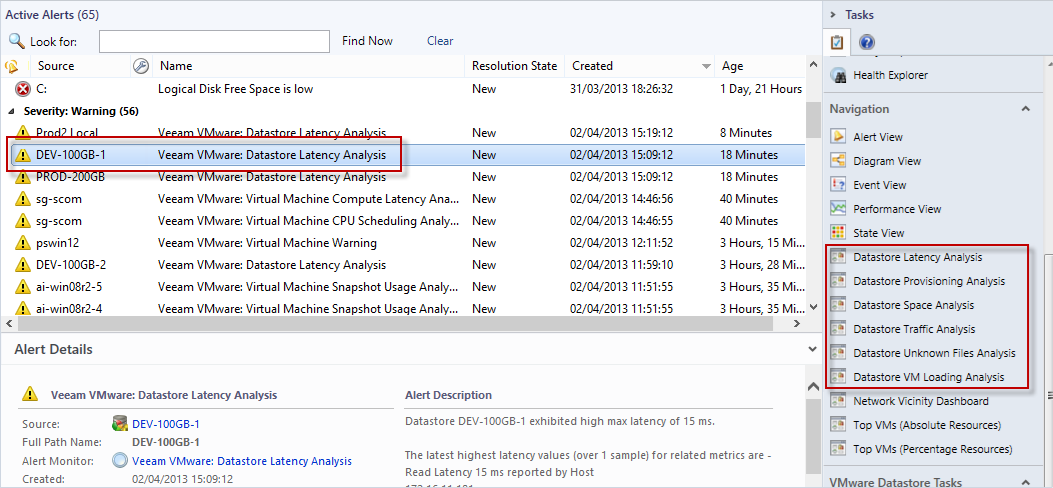
As this alert has a target of datastore, then selecting it makes the set of Datastore Analysis dashboards available in the Navigation pane on the right, as shown in the screenshot below.
In the screenshot below the Datastore Latency Analysis dashboard, launched in-context of this alert, shows in the top-left pane that read latency recently rose sharply on this datastore.
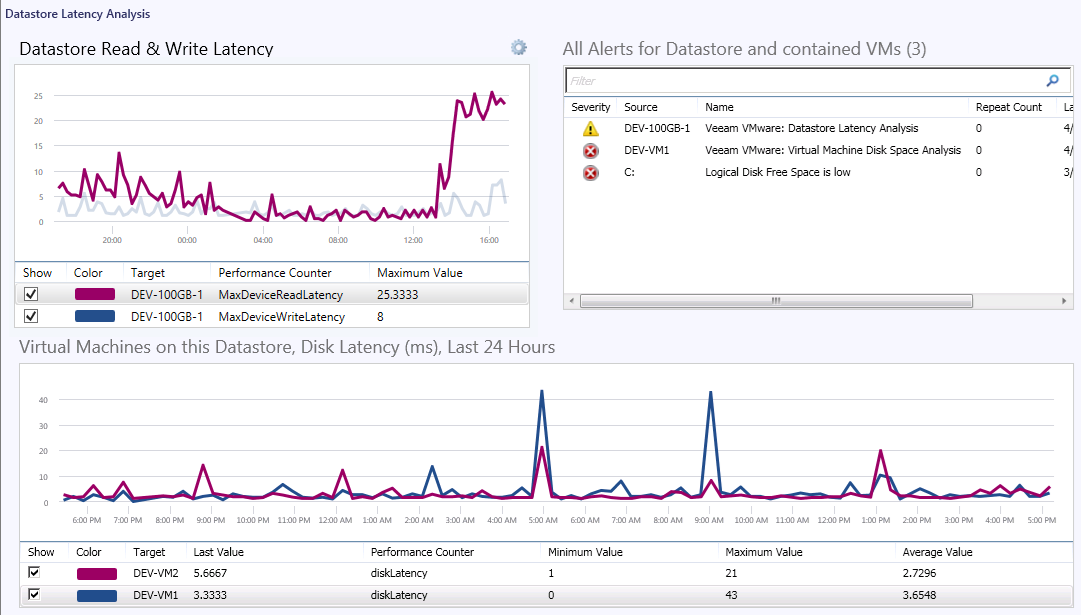
This dashboard leverages further contextual data to show only those VMs that are using this particular datastore in the performance chart in the lower pane. Here it can be seen that latency generally is the same for all VMs on this storage, indicating that the latency is universal across the datastore disks/extents and for all hosts and for all VMs.
The Knowledge Base article for the Datastore Analysis monitor indicates that high traffic on the datastore can overload the capabilities of the storage and lead to high latency.
The Datastore Traffic Analysis dashboard can be used to dive into the I/O for the datastore and all contained VMs as shown in the screenshot below.
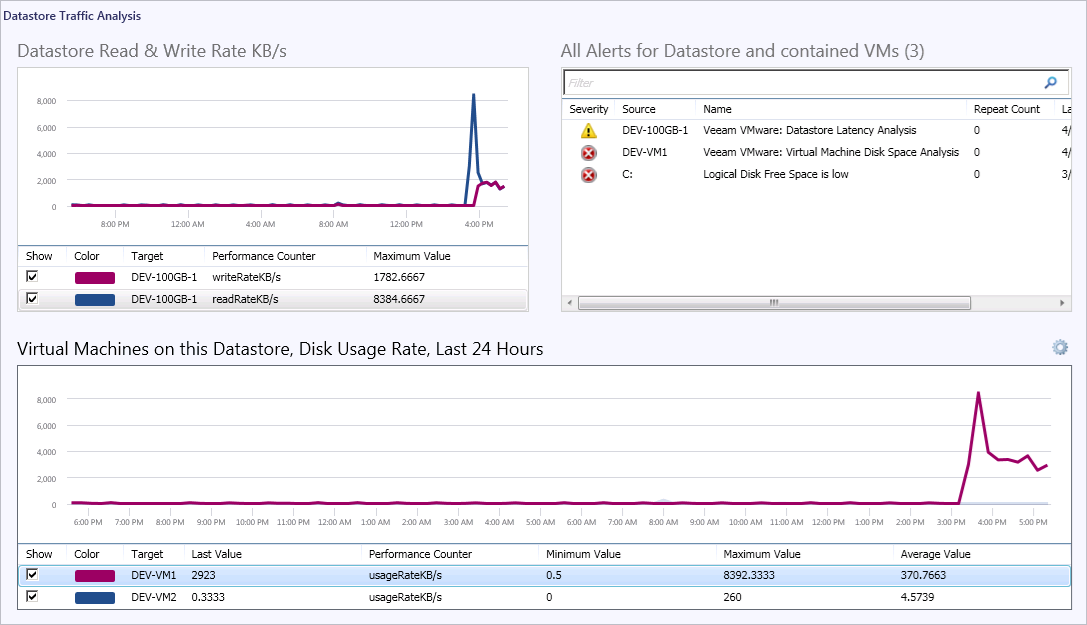
Again, this dashboard leverages the powerful in-context data available in Veeam MP for VMware. Only the VMs which use this datastore are shown in the lower performance chart.
In this chart it can be seen that the disk traffic for one particular VM recently rose sharply. The increase in I/O tracks the timestamp of the latency alert, and indicates that high traffic is overloading the datastore and this VM is the cause.
Review of all open Alerts in the upper right-hand pane can also provide guidance as to whether this issue is isolated to the parent object (datastore), or also affects some or all contained objects (VMs). In this case, the suspect VM is also generating disk space alerts. This certainly indicates that some process is using the disk.
By selecting the VM itself in the lower pane performance chart, further drill-down dashboards become available in the context of Virtual Machine. The VM Storage I/O Analysis dashboard can be seen in the screenshot below.
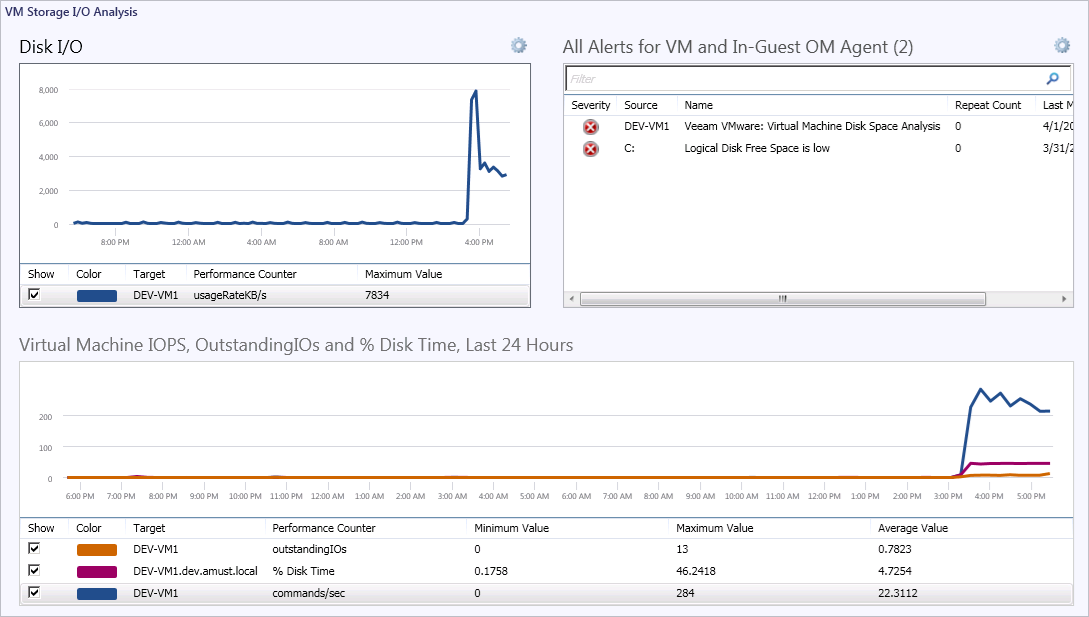
This dashboard confirms the sudden increase in disk traffic both in KB/s (upper chart) and in IOPS (lower chart).
The metric outstandingIOs shows storage commands which are queued for processing, and the increase in this value is an indicator that the storage is being saturated by the disk traffic from this VM.
The metric % Disk Time is also rising sharply — this is one of the metrics gathered by Veeam MP for VMware from inside the virtualized OS, using OpsMgr agent (if present) to provide further guidance on the in-guest perspective of resource usage.
Having used dashboarding to isolate the root cause to this particular VM, troubleshooting can drill in to more granular data. By selecting the VM (for example in the above dashboard) and clicking Performance View in the Navigation pane, the full set of Veeam MP for VMware metrics will be available as shown below.
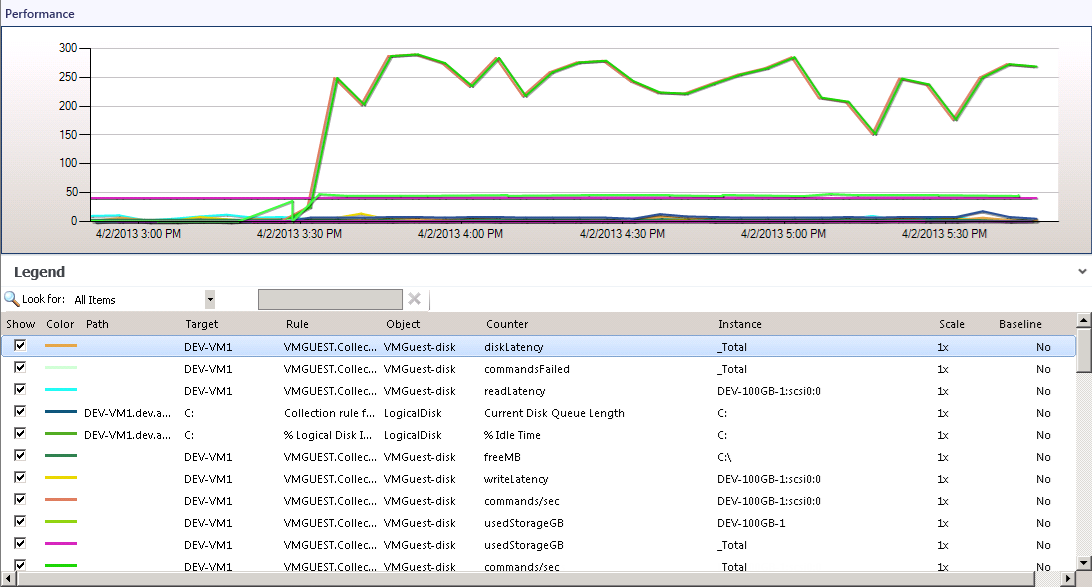
This view will present all available metrics from Veeam MP for VMware, on all aspects of VM performance. By sorting the chart column for ‘Object’, the view can be scoped to VMGuest-disk. This includes disk metrics for latency, traffic, failed commands and outstanding I/O for this VM.
This view, will all metrics available in a single-pane, allows for detailed analysis of the performance and resource usage for this VM over time. It confirms that high disk traffic recently commenced in this VM causing saturation of the backend vSphere storage, thus impacting overall latency (and impacting all VMs).
Note |
Even though the resource bottleneck was in the backend storage, the root cause was a runaway VM process (in this case, IOMeter was used to force high disk I/O in this VM). If troubleshooting had focused on the storage backend, time would have been wasted. However note that Veeam MP for VMware, with the use of in-context dashboards, guided troubleshooting in the correct direction and allowed the root cause to be analyzed faster. |