How It Works
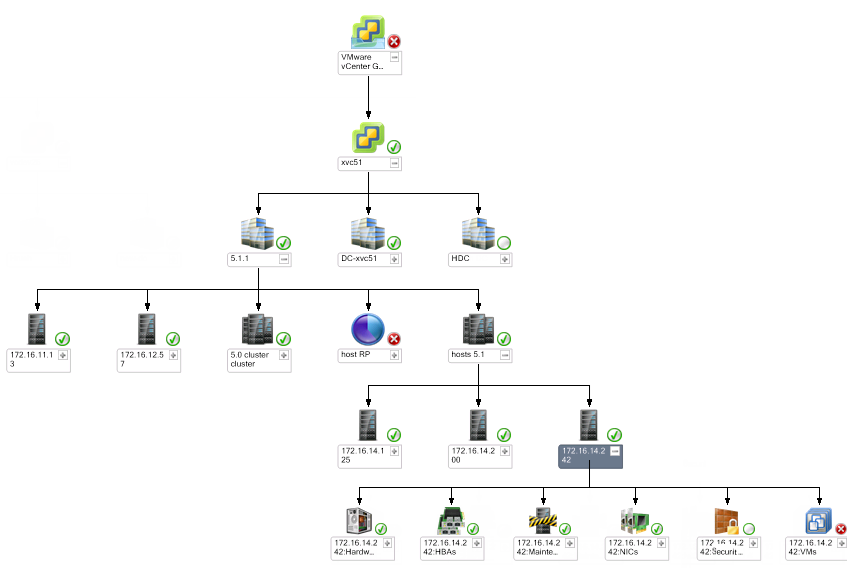
In normal operation, the _vCenter Compute Topology in OpsMgr shows a connected vCenter Server and its child objects (datacenters, clusters and vSphere hosts) similar to the hierarchy below.
When the VE Service loses connection to a vCenter Server:
- The VE Service begins to trigger failure events in its local event log. These events are triggered every poll cycle (5 minutes).
These events are consolidated in the Veeam VMware: Connection lost to VMware vCenter Server monitor. After the default consolidation threshold of 5 is reached (25 minutes by default), the monitor will fire.
Note |
The 25-minute period is configured so that short-term outages (such as a reboot of a vCenter Server) do not cause failover, because the rediscovery process caused by failover takes some time to complete and it is desirable to only trigger failover for a genuine sustained vCenter Server outage. You can modify the default number of consolidated events required to trigger the Veeam VMware: Connection lost to VMware vCenter Server monitor by overriding the UnhealthyConsolidatedEventsCount setting for this monitor. The minimum setting is 2 (10 minutes) and the maximum setting is 5 (25 minutes, default). Note also that the vCenter Server connection is also independently monitored by every Veeam Collector. If a vCenter Server fails, first alerts received will be from Collectors connected to that vCenter Server. These alerts will appear within 5 minutes, and do not trigger any monitoring reconfiguration. |
- When the Veeam VMware: Connection lost to VMware vCenter Server monitor fires, an alert is raised in the OpsMgr console; and a Recovery Action runs to create new direct-to-host connections on each Veeam Collector, bypassing the failed vCenter Server. This is accomplished using a PowerShell interface into the VE Service.
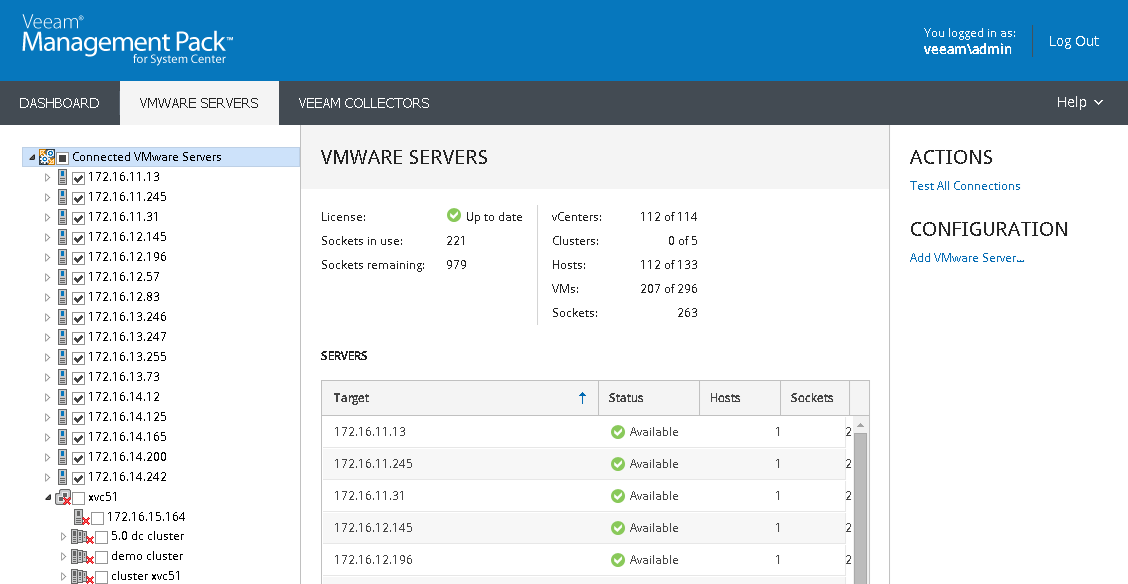
The Recovery Action output will be available for the Veeam VMware: Connection lost to VMware vCenter Server monitor in Health Explorer. You should see that a new connection is configured for each host managed by the failed vCenter Server.
Note |
If the Lockdown mode is enabled for any host managed by a vCenter Server, there is no way to connect to the ESXi host directly. As a result, the Virtualization Extensions Service will not be able to create direct-to-host connections during vCenter Connection Failover. |
- The new direct-to-host connections are distributed to all Veeam Collectors using the normal monitoring job distribution method. The failed vCenter Server connection is not removed, but is ‘unchecked’ (disabled) in the Veeam UI.
Note |
When Virtualization Extensions Service fails over to direct-to-host connections, the direct-to-host collection jobs are load-balanced among all Collectors in the monitoring group. Collectors which were Inactive may become loaded with host monitoring jobs, and hosts may be monitored by different Collectors than were used for the vCenter Server connection. |
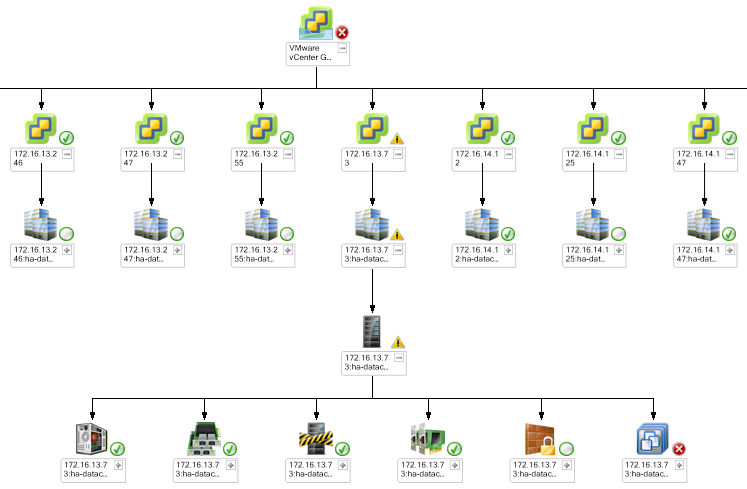
Veeam MP for VMware then rediscovers the VMware topology of hosts and VMs, and monitoring will continue. The _vCenter Compute Topology in OpsMgr illustrates the new connection method, with multiple direct-to-host connections replacing the failed vCenter Server connection:
Consider the following limitations:
- The rebuilt topology will not contain vSphere clusters and datastore clusters, as these are vCenter Server artifacts and are not available when the vCenter Server is offline. Only vSphere hosts, VMs, Distributed Virtual Switches and Standard vSwitches will be displayed.
- VMs will be re-discovered with a new ID, as the vSphere API used when connecting direct to hosts does not provide the same ID as a vCenter Server connection. This will result in VMs being re-discovered effectively as ‘new’ VMs in OpsMgr terms.
Note however that the display name for such VMs in OpsMgr will be the same — only the underlying Operations Manager ID will be different. This will be transparent for normal monitoring situations, but some gaps may be visible in historical reporting once the vCenter Server is restored and failback has occurred.
- Datastore monitoring for direct-to-host connections is disabled by default. When a failover occurs, datastore monitoring is disabled for directly-connected hosts due to limitations in the host API, which reports shared datastores as multiple duplicate datastores for every host connection. The performance metrics for such datastores are inaccurate, as individual hosts are not aware of other host activities on shared storage. This duplication of datastores can also cause the monitoring load on Collectors and the OpsMgr system to increase significantly.
For these reasons, datastore monitoring is automatically disabled by default for direct-to-host connections and it is not recommended to enable it when using the vCenter Connection Failover feature.
Note |
If monitoring of direct-to-host connections and their attached datastores is a requirement (for example, for remote office/branch office situations, where hosts are not part of a vCenter Server then datastore monitoring can be enabled by using the advanced MonitorDatastoresForDirectHost setting in the Veeam UI. This setting can be applied to a separate monitoring group in the Veeam UI which holds only direct-to-host connections, allowing flexibility to use both direct-to-host and vCenter Server connection methods in one environment. |
- If you work with a large number of direct-connected vSphere hosts, the Veeam Virtualization Extensions UI application may suffer degraded performance. It is strongly recommended to use the Veeam VEShell interface for configuring and managing the Veeam Virtualization Extensions Service. For more information on the available PowerShell cmdlets for managing the Veeam Virtualization Extensions Service, see Veeam VEShell Reference.


