Pro-active and Intelligent Alerting
Veeam MP for VMware comes with a number of smart analysis monitors that produce relevant and useful alerts, and provide real-time analytics calculated for your specific environment. The detailed built-in knowledge base help front-line operators speed up root-cause analysis.
The following example shows the Veeam VMware: Virtual Machine Storage Latency Analysis monitor raised for a VM that is experiencing storage latency issues. The monitor provides information on the datastore used to store the VM files, and displays virtual disks with the highest read and write latency values.
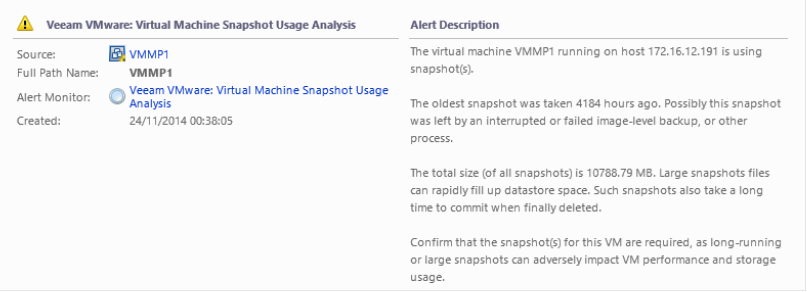
The following example shows the Veeam VMware: Virtual Machine Snapshot Usage Analysis monitor raised for a VM whose snapshots are either outdated or too large. The monitor tracks the age and size of VM snapshots, and contains dynamically generated message to help you identify the root cause of storage performance issues.

