Step 5. Review VMware Servers Tab
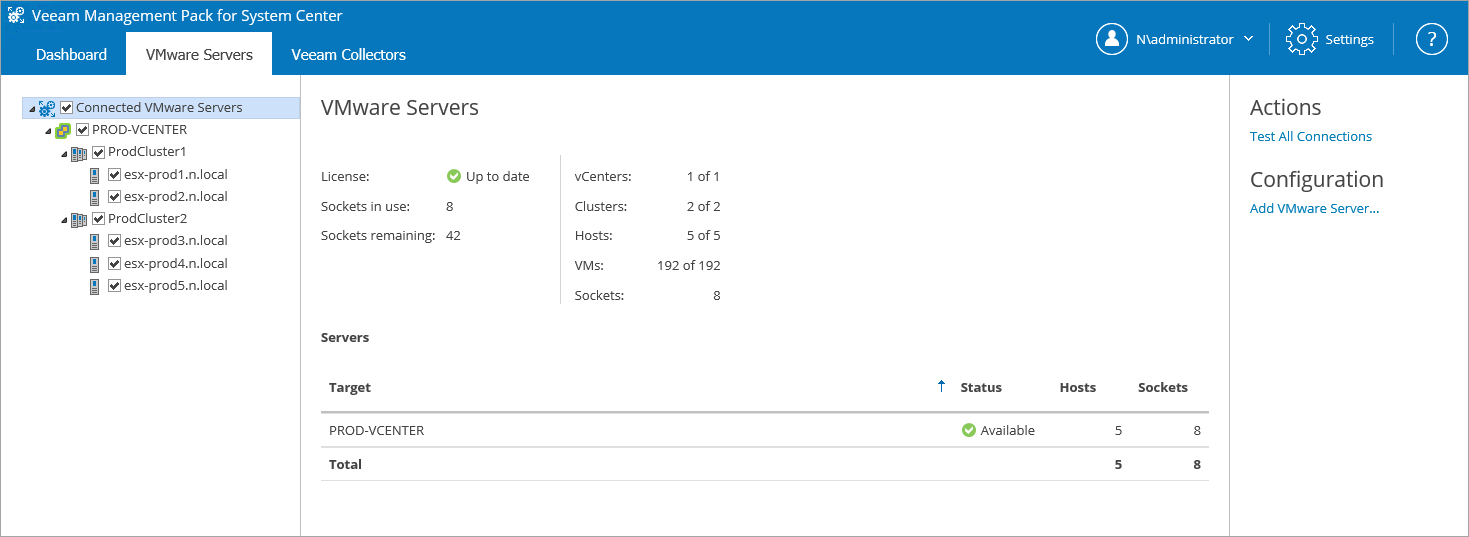
On the VMware Servers tab, expand the Connected VMware Servers tree. In this example, you will see 1 vCenter Server connection, 2 clusters, and total of 5 hosts.
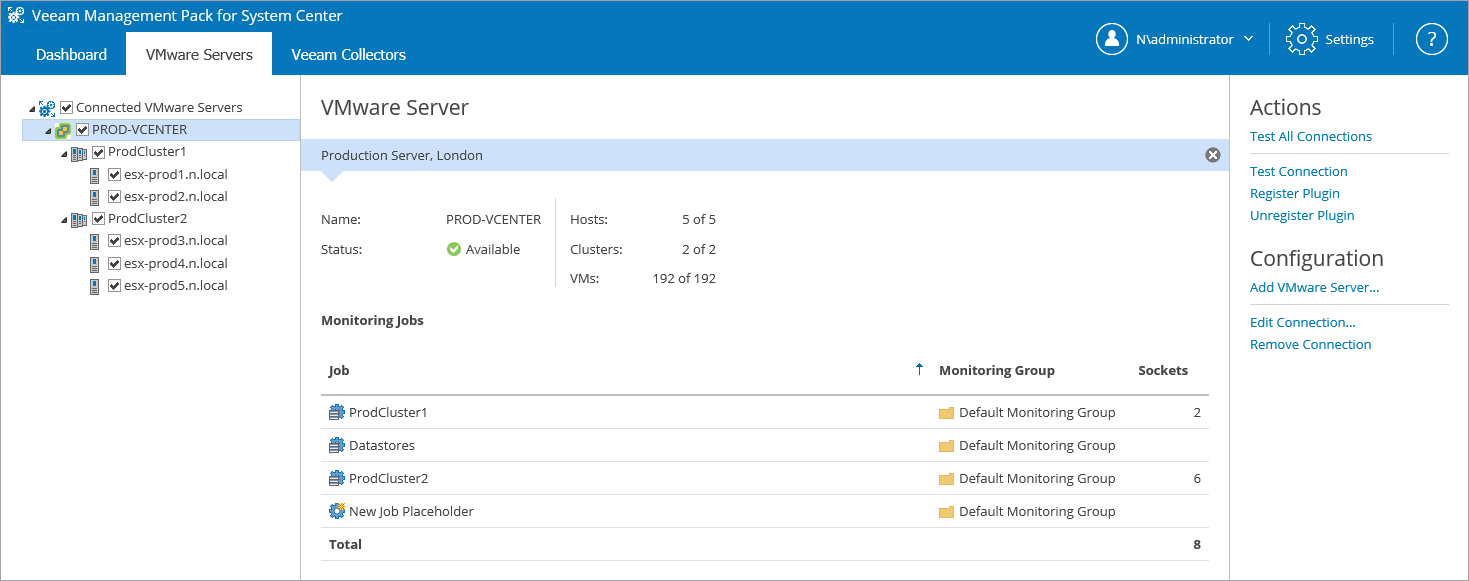
The details pane will display information on the selected node. The Configuration section on the right will display all related configuration tasks.
With the root Connected VMware Servers node selected, the details pane will display the target vCenter Server, its status, the number of clusters, hosts, VMs, and the number of remaining sockets and sockets in use.
With a vCenter Server target selected, the details pane displays information on the target connection status, number of clusters, hosts and VMs, and distribution of jobs among monitoring groups. The Configuration section on the right will display two additional configuration tasks that refer to this specific monitoring target: Edit Connection and Remove Connection.
You can use this tab to exclude clusters or individual hosts from monitoring. To do that, clear check boxes next to objects that you want to exclude. This will disable the data collection for these systems, and they will not appear in OpsMgr. Socket licenses for the excluded hosts will be returned to the pool managed by the VE Service.