Top Dashboards
Top dashboards show top virtual infrastructure objects for resource usage. There are several Top dashboards available in the root Veeam for VMware folder which have a global scope — for example, the Top Virtual Machines dashboard shows the top virtual machines for resource consumption for the entire environment.
These dashboards can also be launched in-context when a parent (‘container’) object is selected. For example, if you select a vSphere host in any view (Alert, State, Topology and so on), the Navigation pane in the Tasks sidebar will show available Top VMs dashboards:
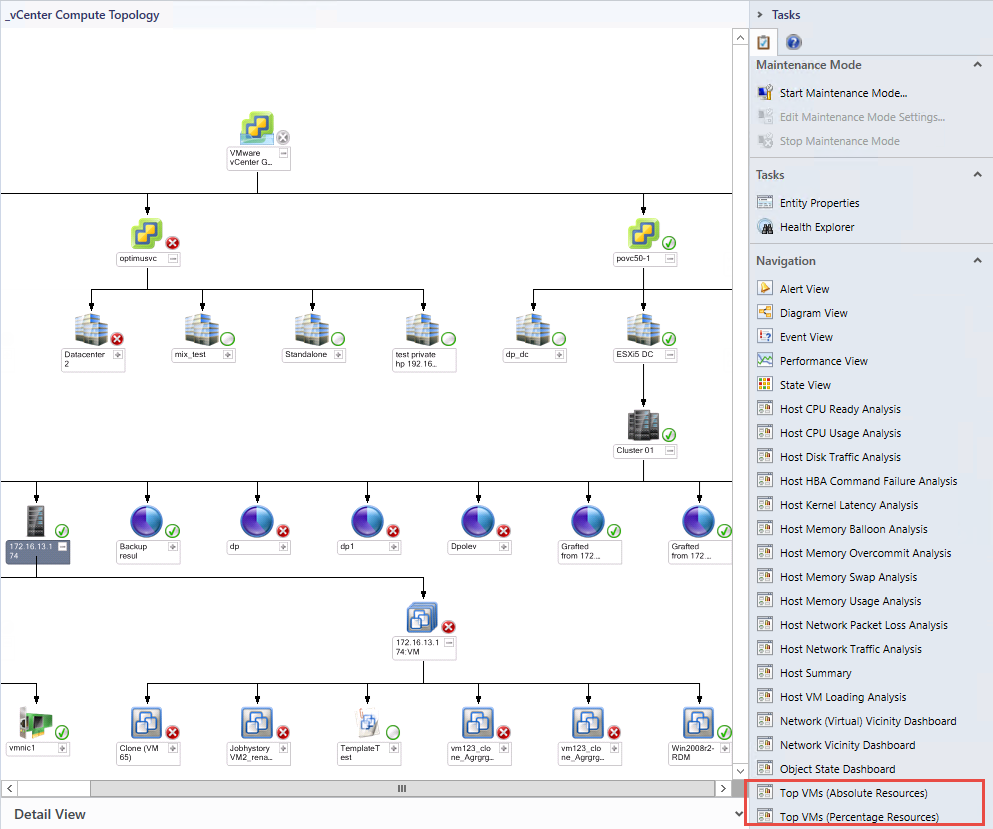
Click the Top VMs (Absolute Resource) link to show the Top VMs for the key CPU, memory, disk and network traffic metrics for that host only.
Note |
If a metric value for an object (for example, for a VM) is not available, the metric tile will be highlighted with gray. This is useful for identifying switched-off VMs. |
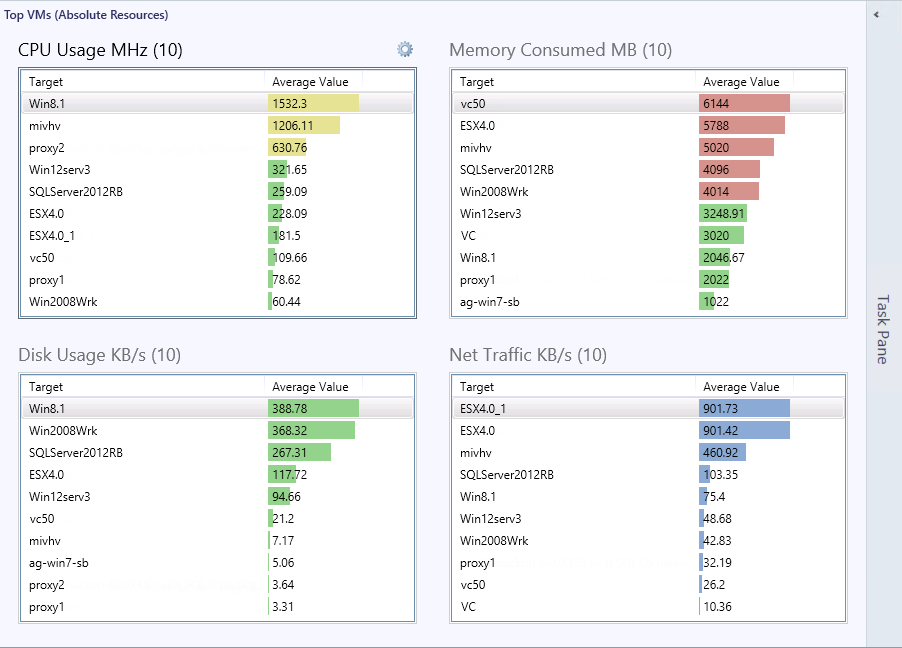
To speed up performance analysis and identify infrastructure objects with performance issues, Veeam Top Dashboards feature Traffic Lights — that is, warning and critical thresholds that are used to highlight objects in the widgets. For example, the screenshot above shows that three VMs are in yellow (warning) state for CPU Usage MHz and five VMs are in red (critical) state for Memory Consumed MB.
Note |
Performance data in Top dashboards is averaged over the last 4 hours. |
The default configuration of the traffic light widgets can be customized. For details on changing widget settings, see section Personalizing Veeam Dashboard Widgets.
In This Section