Virtual Machine Analysis Dashboards
The Virtual Machine Analysis dashboards can be launched in context of Virtual Machine. The following Virtual Machine Analysis dashboards are available:
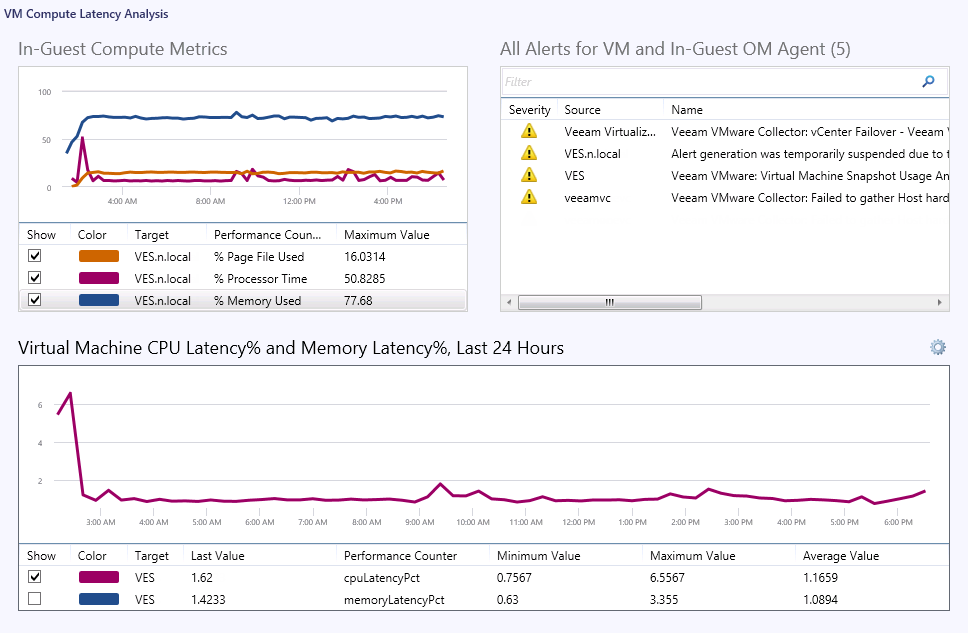
VM Compute Latency Analysis
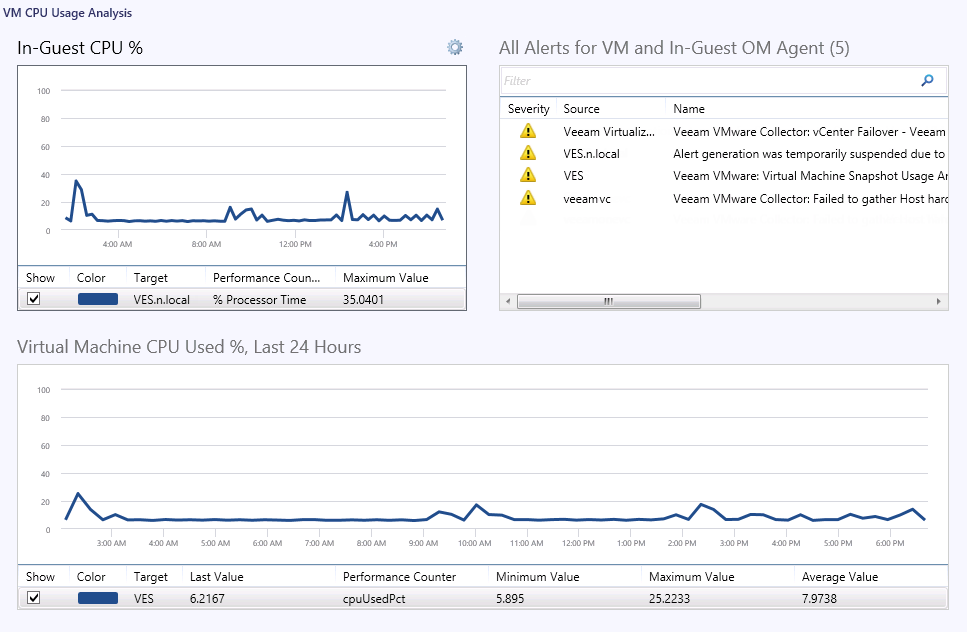
VM CPU Usage Analysis
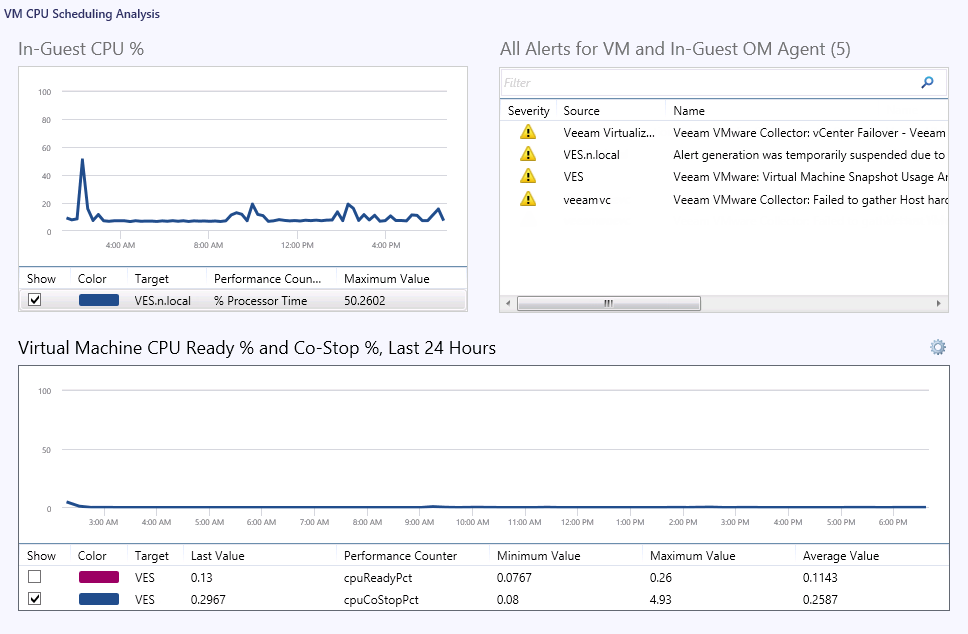
VM CPU Scheduling Analysis
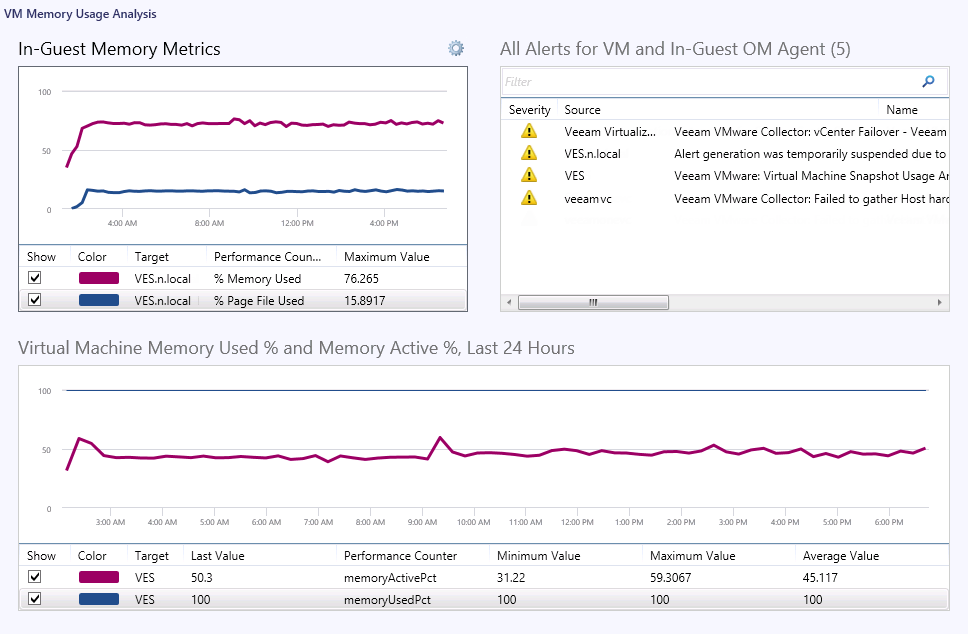
VM Memory Usage Analysis
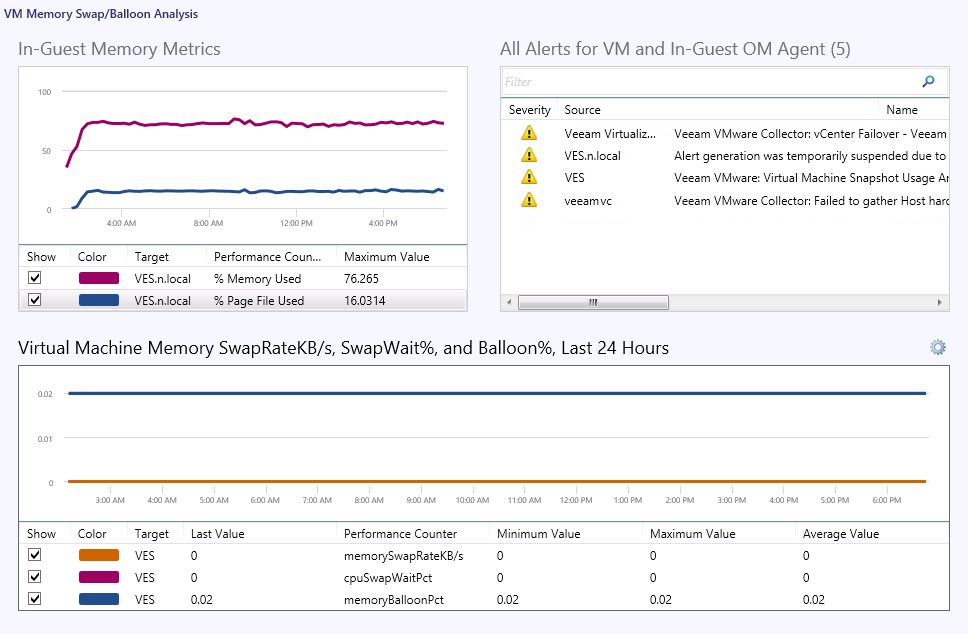
VM Memory Swap/Balloon Analysis
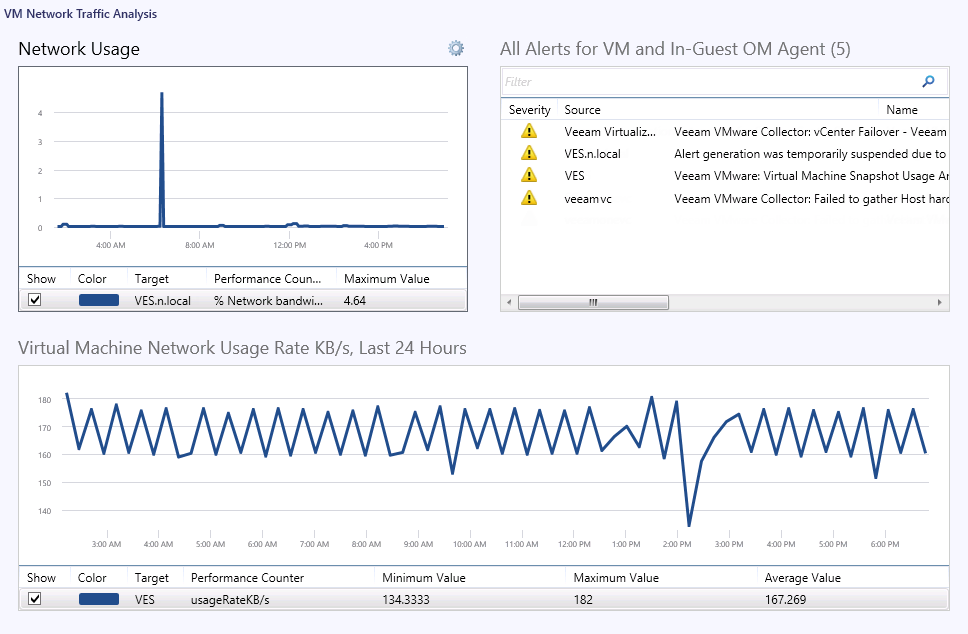
VM Network Traffic Analysis
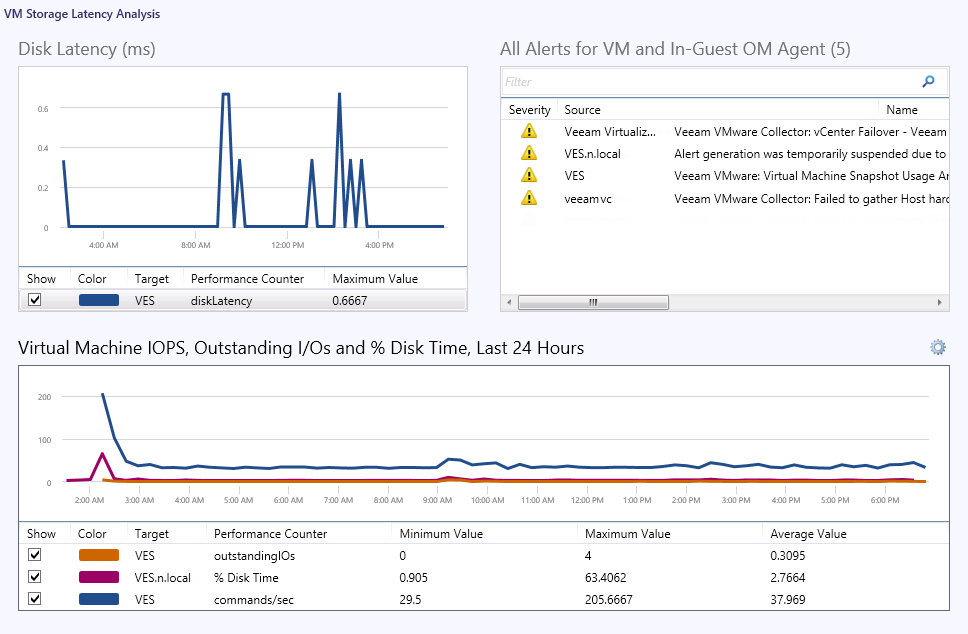
VM Storage Latency Analysis
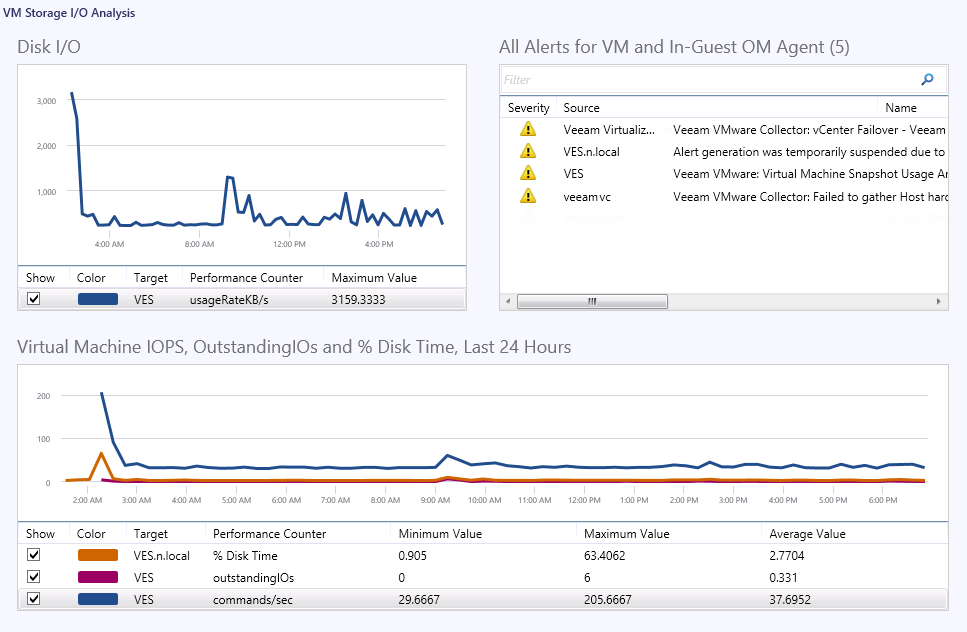
VM Storage I/O Analysis
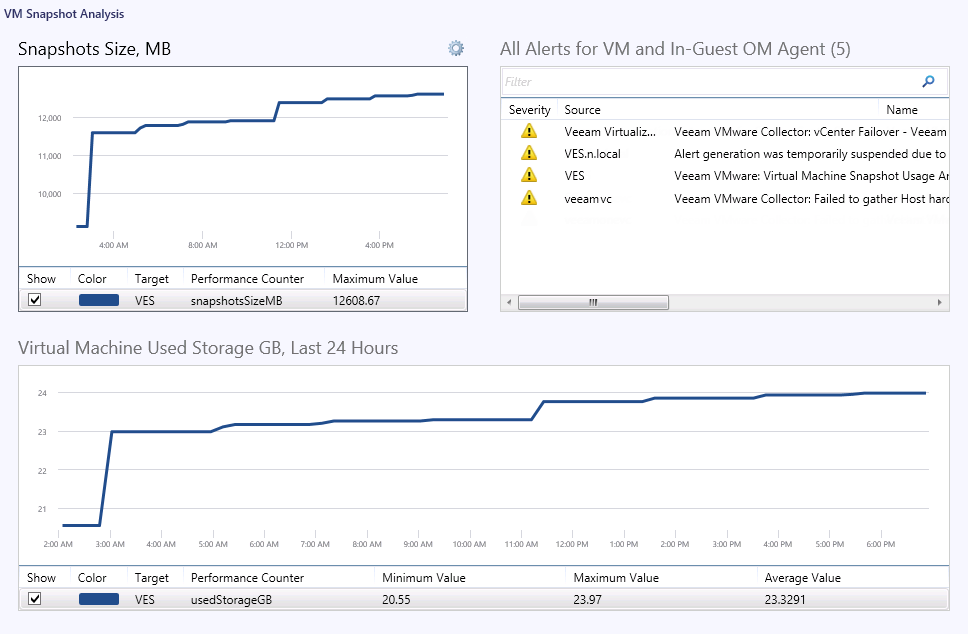
VM Snapshot Analysis
Note |
For the Analysis Dashboards scoped at Virtual Machine, the performance chart in the upper left pane may display one or more of the following metrics collected using the in-guest OpsMgr agent, if present. |
Object | Counter |
VMGuest-cpu | % Processor Time |
VMGuest-memory | % Memory Used |
VMGuest-memory | % Page File Used |
VMGuest-memory | Pages/sec |
VMGuest-net | % Bandwidth Used |
VMGuest-disk | % Disk Time |
If the OpsMgr agent is not deployed inside the virtualized OS, then these metrics will not be available and the upper left pane in the dashboard may be empty.