Personalizing Traffic Lights Widgets
You can enable the traffic light feature for Top Dashboard widgets, or change the default widget thresholds:
- Open a Top Dashboard.
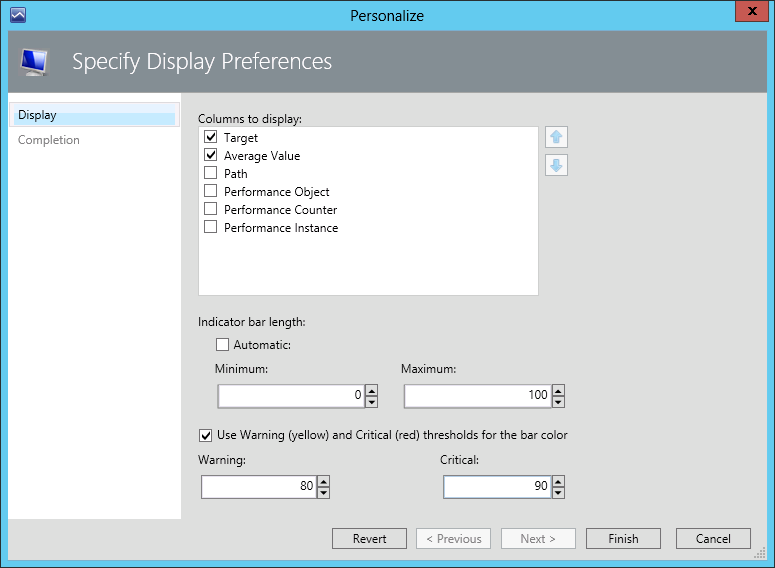
- Click the gear icon to the right of the necessary performance metric and select Personalize.
- Select the Use Warning (yellow) and Critical (red) thresholds for the bar color check box.
- Specify values for the Warning and Critical thresholds.
- Click Finish.
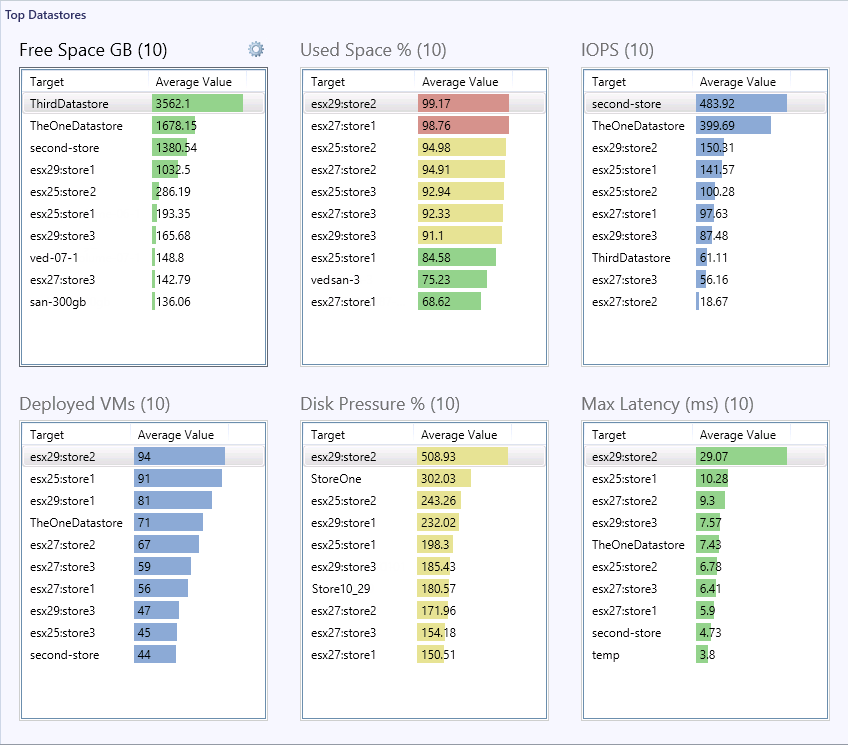
As a result, the bars on the charts will be highlighted with traffic light colors:
- If the Critical threshold is breached, performance metric value will be highlighted with Red.
- If the Warning threshold is breached, performance metric value will be highlighted with Yellow.
- If none of the thresholds is breached, performance metric value will be highlighted with Green.
For example, the screenshot below shows the Top Datastores dashboard with specified thresholds for Free Space, Used Space, Disk Pressure and Latency metrics.
To return back to the default widget settings, choose to personalize the widget and click Revert.