Troubleshooting
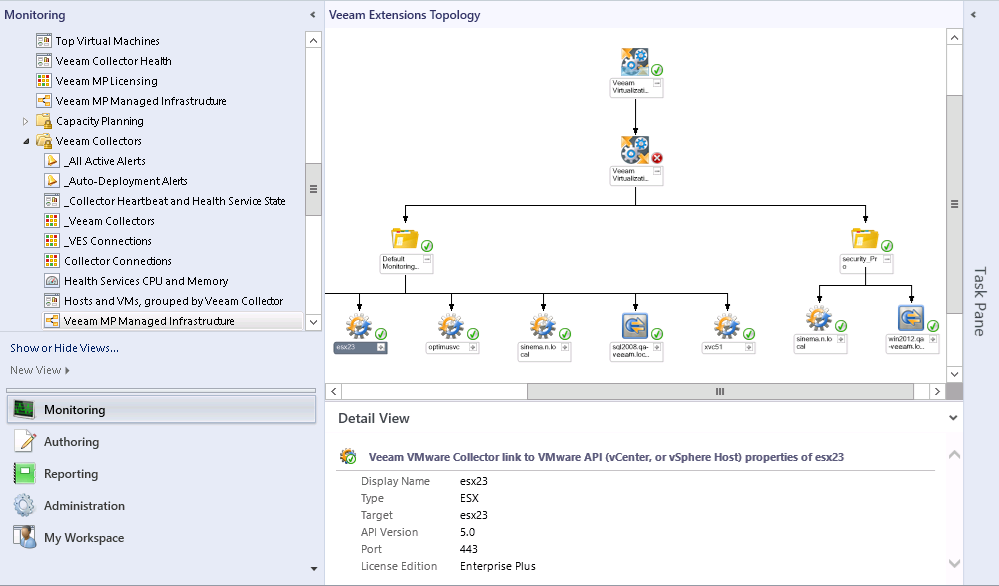
The Veeam components are largely ‘self-monitoring’ using built-in OpsMgr functionality, and additional rules and monitors in Veeam MP for VMware; the first step in troubleshooting should be to review the Veeam MP Managed Infrastructure view showing Extensions Service, Monitoring Group (default), Collector heartbeat tracker and vCenter Server connection:
Alerts visible here will refer to licensing, service status, and connections to VMware systems for:
- VE Service
- Veeam Collectors
Use the other available views in the Veeam for VMware > Veeam Collectors subfolder of views to troubleshoot problems in the Veeam back-end collection infrastructure.
Also check standard OpsMgr alerts (in the Monitoring > _All Active Alerts view) for the status of the OpsMgr Agents deployed to the Veeam servers.
Some specific troubleshooting scenarios are examined in more detail further.
In This Section
- Viewing and Exporting Logs
- Problems Accessing and Displaying Veeam UI
- Veeam MP Dashboards/Views are Empty
- Veeam Components Not Visible in OpsMgr
- VMware Objects Not Visible in OpsMgr
- Unstable Behavior from OpsMgr Health Service
- Missing Alerts in the OpsMgr console
- Troubleshooting Event and Performance Data Delivery
- How to Open Veeam Customer Support Call
