Datastores. Overprovisioned Storage
Thin provisioning allows administrators to allocate for virtual machines more storage space than there is real physical capacity. This report helps you reveal excessive storage over-provisioning in your virtual environment.
Example Output
In this example, the report allows you to show datastores with the largest amount of over-provisioned storage space for this month.
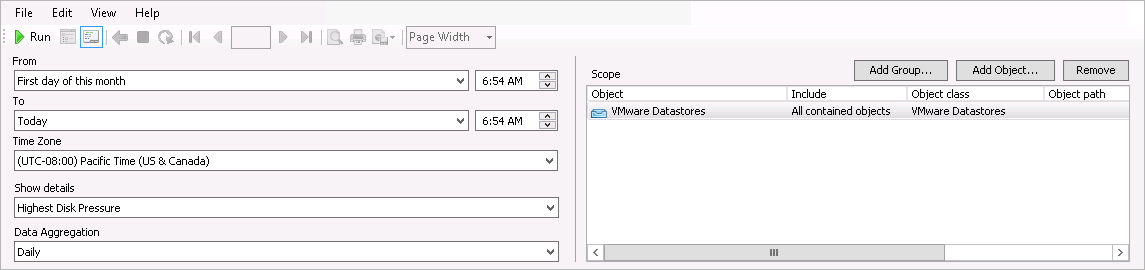
To run this report:
- From the From list, select This month > First day. From the To list, select Today.
- From the Show details list, select Highest Disk Pressure.
- From the Data Aggregation list, select Daily.
- Leave the Scope section without changes.
- Click Run to view the report.
The TOP 5 Over-provisioned Datastores (GB) chart will show 5 most over-provisioned datastores, and graphically display the difference between the datastore capacity, provisioned and used space. The TOP 10 Over-allocated by Storage VMs chart will show 10 VMs with excessive amount of allocated space, and graphically display the difference between allocated used and unused space.
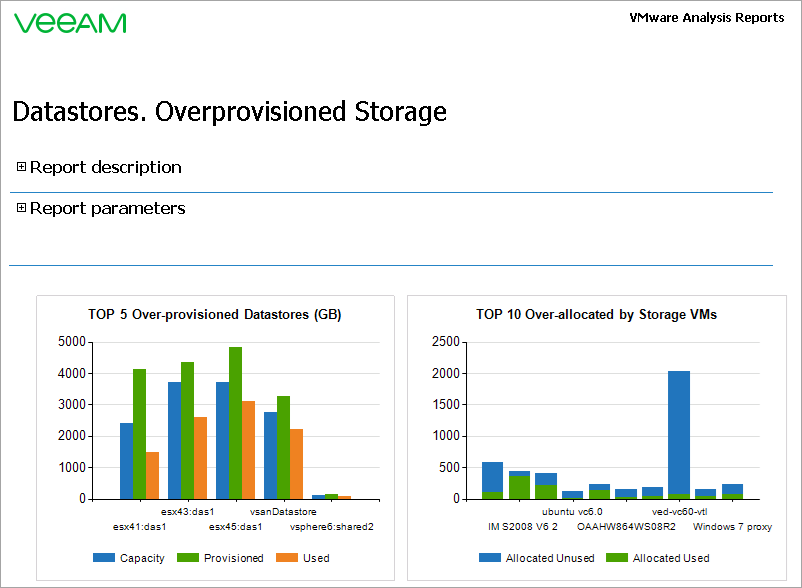
It can be seen from the report output that the most over-provisioned datastore of the previous month was esx45:das1, while the ved-vc60-vtl VM had the greatest amount of unused allocated space.
For each datastore, details tables will provide information on the number of VMs residing on the datastore, free and provisioned space, capacity, disk pressure and the percentage of provisioned space that is actually used.
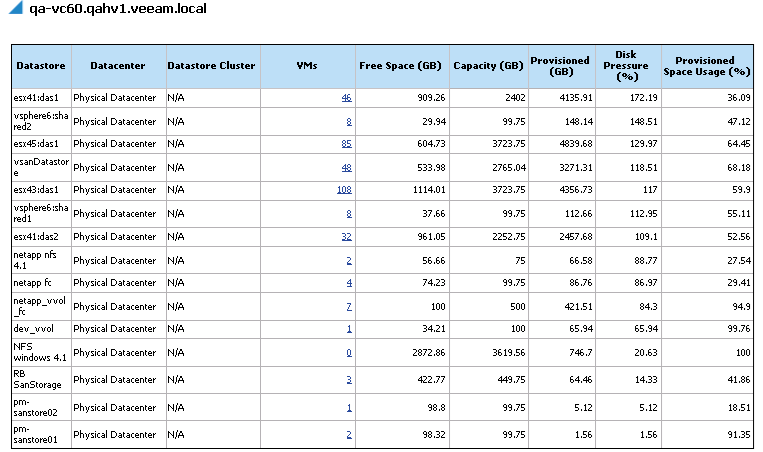
You can click a number in the VMs column of a details table to drill down to performance charts and statistics on storage space usage.