Top/Bottom N Contained Objects or Instances
This report shows top or bottom objects for a specific performance counter across a time range.
Example Output
In this example, the report on top 10 virtual machines with the highest CPU usage has been run for all vSphere hosts for this week.
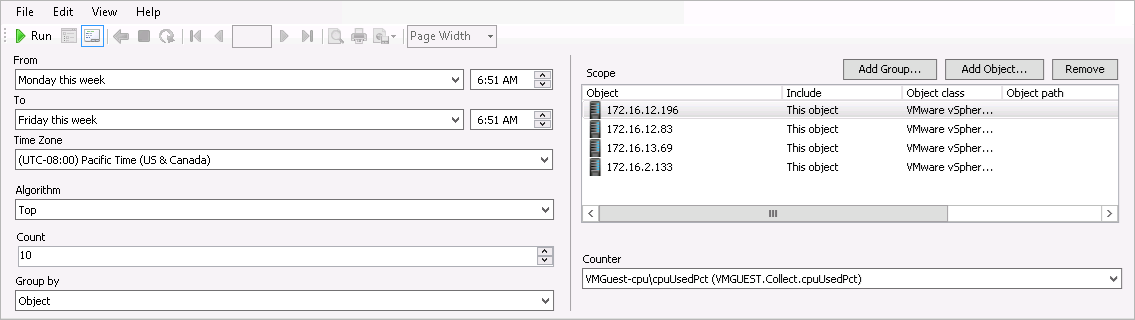
To run this report:
- Open the vSphere Hosts. Top (Bottom) N Contained Objects or Instances report.
- From the From list, select This week > Monday. From the To list, select This week > Friday.
- From the Algorithm list, select Top.
- In the Count field, enter 10.
- From the Group by list, select Object.
- In the Scope section, include all hosts in the report.
- From the Counter list, select VMGuest-cpu\cpuUsedPct (VMGUEST.Collect.cpuUsedPct).
- Click Run to view the report.
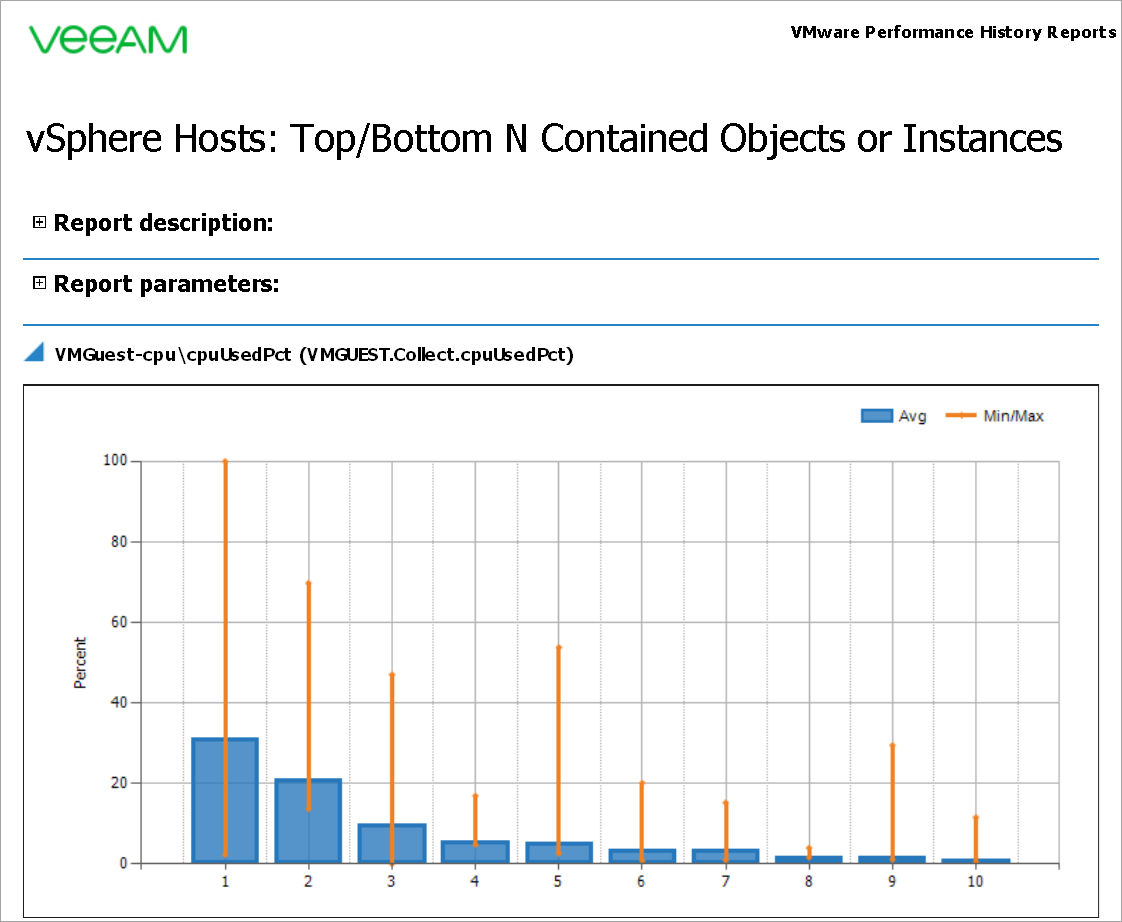
The report will show top 10 VMs with the greatest CPU usage level.
The chart will display the following details for every VM: average CPU usage (the blue column) and the minimum-to-maximum CPU usage range (the orange line) for the week.
The table will display additional details for every VM: VM name, sample count, minimum, maximum and average CPU usage values and standard deviation.
In this example, the vCloud Director VM is reported to be the top CPU consumer: its average CPU value is 31,21.
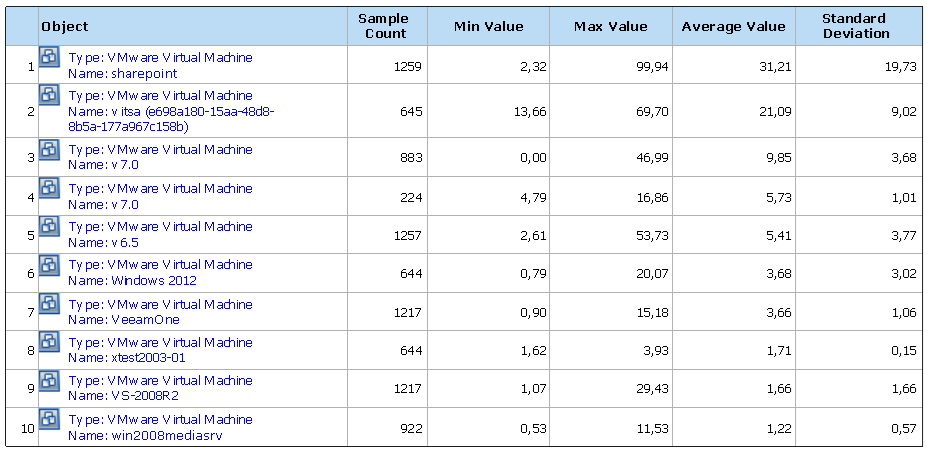
You can click a VM name in the output table to drill down to the Veeam Performance Details Report from the Veeam Report Library.