Health Explorer
Health Explorer shows the status of monitors running against the VMware object you selected, and provides historical state changes and additional knowledge.
By default in the OpsMgr 2016 and later Health Explorer, only monitors that are in a Warning/Critical state are shown. To show all available monitors, click the Filter Monitors button.
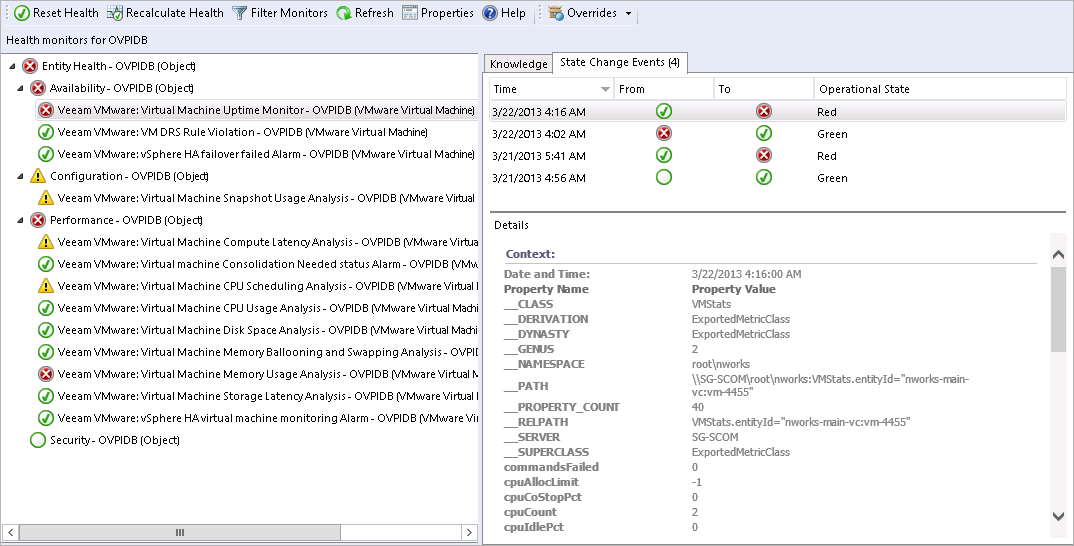
Below is an example of the Health Explorer for a virtual machine, showing the state change events for the Veeam VMware: Virtual Machine Uptime Monitor which tracks the availability of each VM.
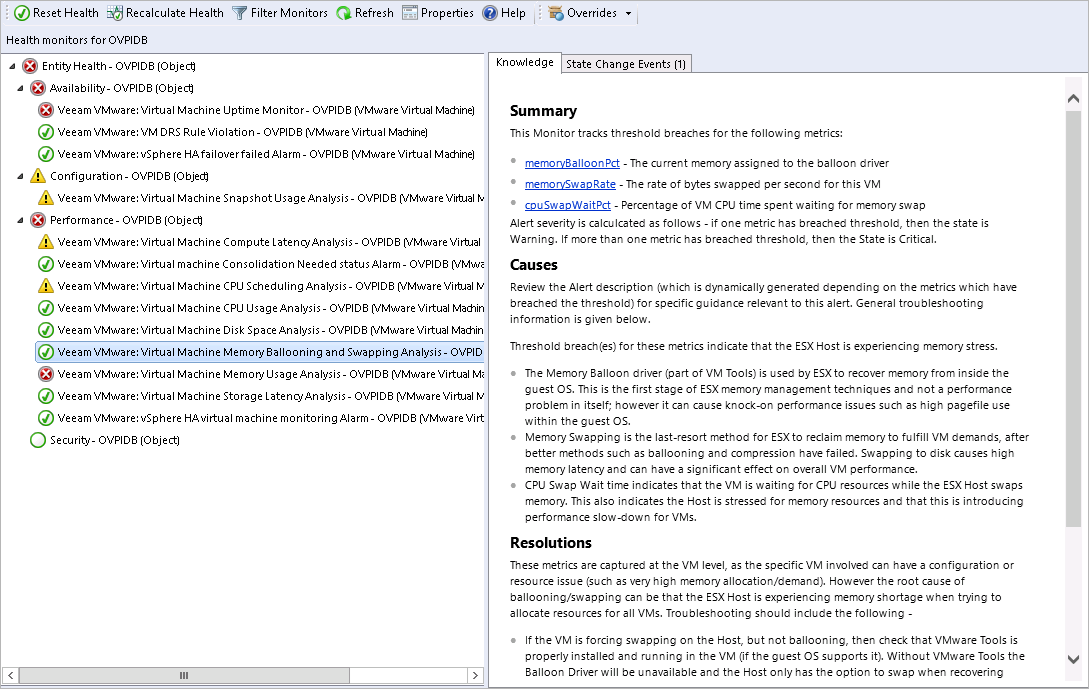
Health Explorer can also show the knowledge base articles for all monitors, in the example below for monitor Veeam VMware: Virtual Machine Memory Ballooning and Swapping Analysis.
The KB article contains detailed explanation of metrics, links to Veeam online documentation resources such as the Veeam MP for VMware Help Center, and VMware articles and documentation.
For guidance on customizing the thresholds for this monitor, see Tuning Management Pack for VMware.