Datastores. Performance Heatmap
This report analyzes datastore performance and shows how latency and IOPS metrics have grown across a time range on the datastore. The report helps identify datastores with heavy load, analyze IOPS and latency values for every VM, and detect whether datastores can sustain the current workload.
Example Output
In this example, the report allows you to detect VMs for which the number of IOPS has grown by over than 30% during this week on a specific datastore.
To run this report:
- From the From list, select This week > Monday. From the To list, select This week > Friday.
- In the Scope section, include the necessary datastore in the report.
- In the Threshold field, enter 30.
- From the Threshold is For list, select Growth of IOPS (relative).
- Leave the Cell Capacity (IOPS) field without any changes.
- Click Run to view the report.

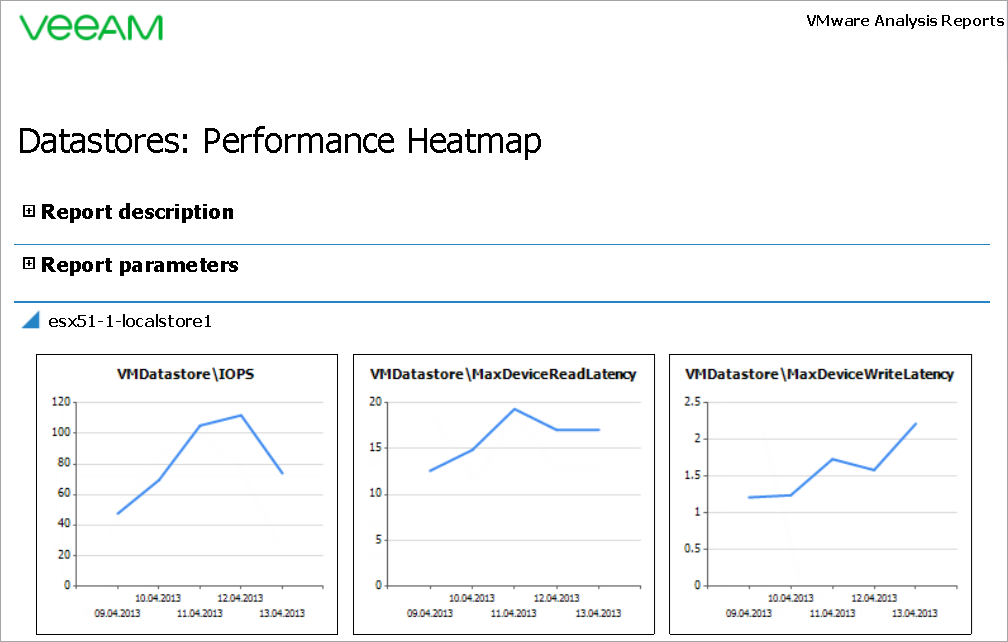
The report will display 3 performance charts for the datastore IOPS, maximum read and write datastore latency.
The report will draw the Heat Map that illustrates the average number of IOPS for every VM for the last day of the reporting period (that is Friday). The number of IOPS for every VM is presented as a colored bar. The bar is comprised of cells, each cell indicates 10 IOPS.
The bar color depends on the IOPS growth rate:
- Green: the average number of IOPS on Friday has grown by less than 30% in comparison to the average IOPS number on Monday (the first day of the reporting period).
- Red: the average number of IOPS on Friday has grown by over 30% in comparison to the average IOPS number on Monday (that is, the threshold was breached).
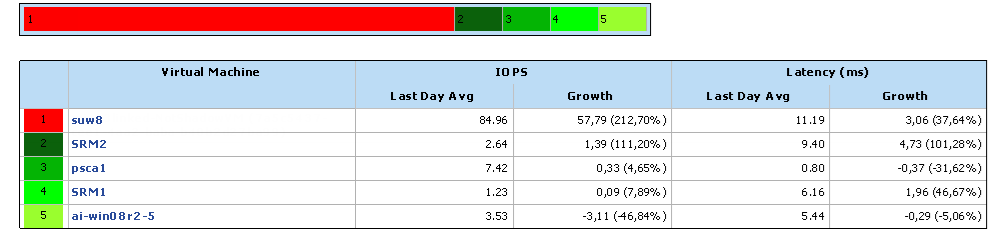
The report table will list all VMs whose files resided on the datastore and show the following metrics for every VM:
- IOPS: the average number of IOPS for Friday and the IOPS growth (the average number of IOPS for Monday compared to the average number of IOPS for Friday)
- Latency (ms): the average latency for Friday and the latency growth (the average latency for Monday compared to the average latency for Friday)
It can be seen from the report output that there are 5 VMs on the selected datastore, but only VM #1 is colored red, as its average number of IOPS exceeded the specified 30% threshold.
You can click a VM name, a datastore name or a cell on the Heat Map to drill down to the Veeam Performance Details Report from the Veeam Report Library.