What-if VM Deployment Planning for VMware (manual resource entry)
This report calculates the number of additional VMs that your existing infrastructure (vSphere clusters and datastores) can support before the resource utilization reaches the specified threshold value. The report evaluates total capacity of your infrastructure and provides estimation of how many sample VMs of a certain profile can be added without causing the specified resource utilization threshold to be breached. In this report, you can specify parameters for the VM profile manually.
Example Output
The report can be scoped at one or more vSphere clusters and one or more datastores in your environment. In this example, the report calculates how many VMs of the specified profile (5 VMs, 3 GHz CPU, 4 GB memory, 250 disk IOPS) can be added to your infrastructure (taking into account free space threshold set to 20%).
To run this report:
- From the Performance Data From list, select Previous month > First day.
- From the Forecast Horizon list, select a date in future (30 days from today).
- Leave the Scope section without changes.
- In the VM COUNT field, enter 5.
- In the VM config - CPU GHz field, enter 3.
- In the VM config - Memory GB field, enter 4.
- In the VM config - IOPS field, enter 250.
- In the VM config - Resource usage % field, enter 85.
- In the Threshold: Datastore Free Space (%) field, enter 20.
- Click Run to view the report.
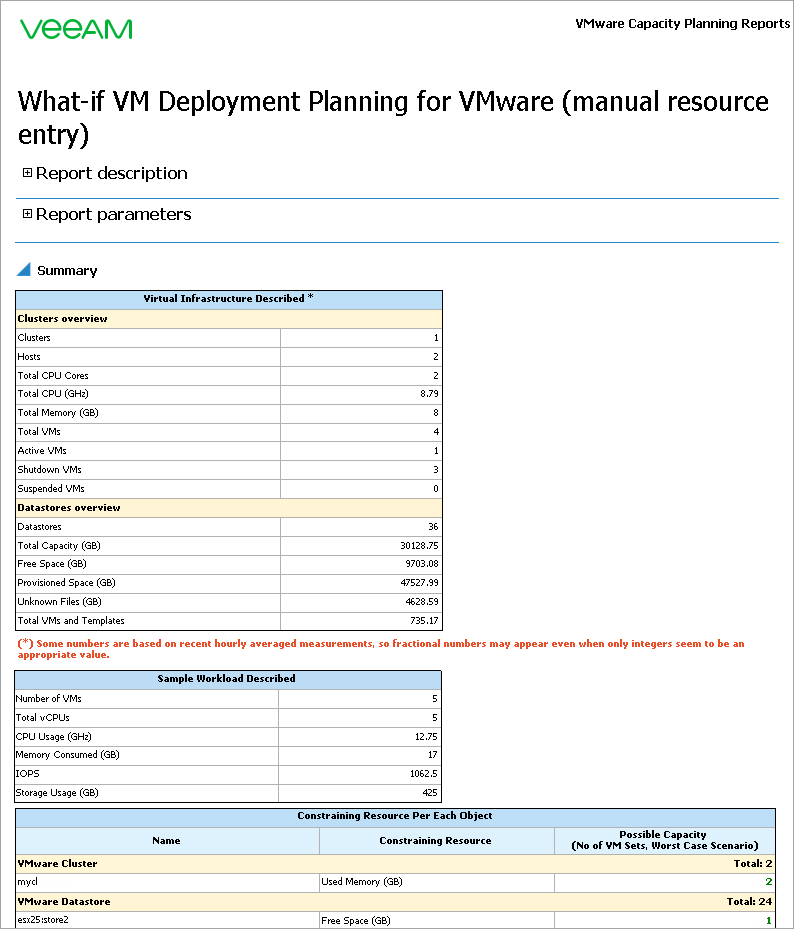
The Virtual Infrastructure Described table will provide an overview for all datastores and clusters included in the report scope: total number of datastores and clusters, total number of hosts, total number of CPU cores, total capacity, amount of free and provisioned space, amount of space consumed by unknown files and the number of VMs residing on the datastores (note that this number will include both VMs and VM templates).
The Sample Workload Described table will provide an overview for the virtual machine used as a sample for calculating the number of VM sets: total number of VMs, total vCPUs, total CPU usage, memory usage and number of IOPS.
The Constraining Resource per Each Object table will provide the resource for which the specified threshold will be breached first within the forecast period and number of additional VMs of the specified profile that your infrastructure will be able to support on the forecast horizon date:
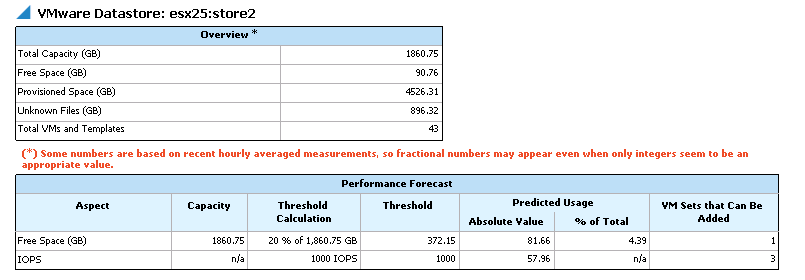
The Performance Forecast tables reveal the predicted free space usage and IOPS numbers and shows how many VMs you can add, taking into account available resources in future.
In this example, the report shows that datastore free space is the constraining resource for the datastore. The datastore can host only 1 more VMs in terms of free space, whereas in terms of IOPS, you can add 3 VMs.


