Performance History
These reports aggregate historical data and show performance statistics across a time range.
Performance history reports feature predefined lists of different performance counters and allow you to report on memory, CPU, disk and network usage.
Example Output
In this example, the report on the disk usage rate has been run for all vSphere hosts for this month.
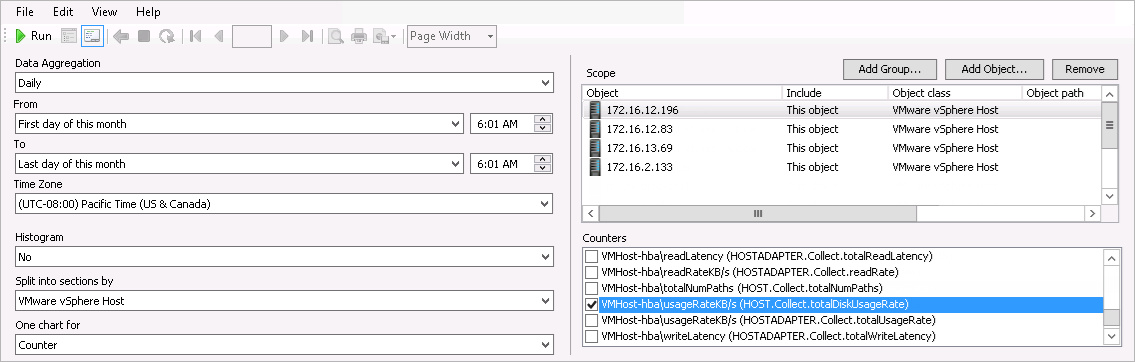
To run this report:
- Open the vSphere Hosts. Disk Performance History report.
- From the Data Aggregation list, select Daily.
- From the From list, select This month > First day. From the To list, select This month > Last day.
- From the Histogram list, select No.
- In the Split into sections by list, select VMware vSphere Host.
- In the Scope section, include all hosts in the report.
- From the One chart for list, select Counter.
- From the Counters list, select VMHost-hba\usageRateKB/s (HOST.Collect.totalDiskUsageRate).
- Click Run to view the report.
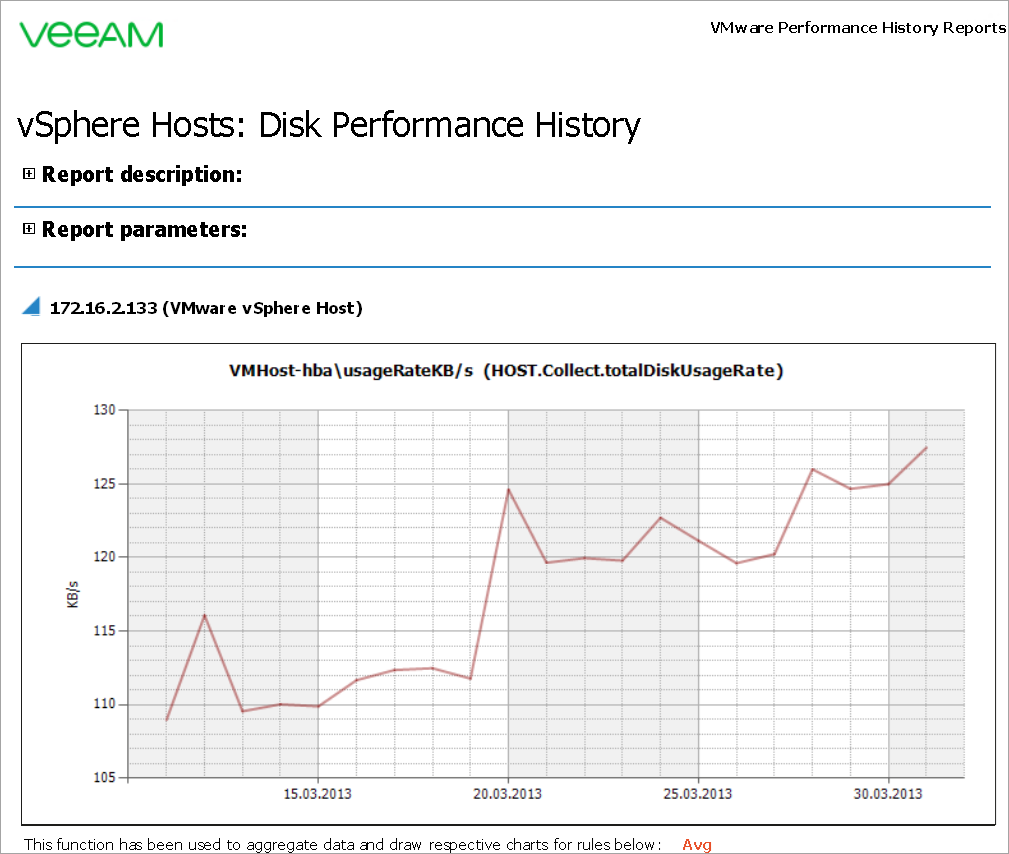
The report will show how the average disk usage rate has been changing for the selected hosts during this month.
The table will detail daily values for disk usage (sample count, average, minimum and maximum and standard deviation values).
In this example, the report shows that the 172.16.2.133 host average disk usage has been constantly growing during the reporting period, though the average value has slightly decreased on 25.03. in comparison with 20.03. (the average usage rate on 20.03. was 124,6 KB/s, while on 25.03. — only 121 KB/s)
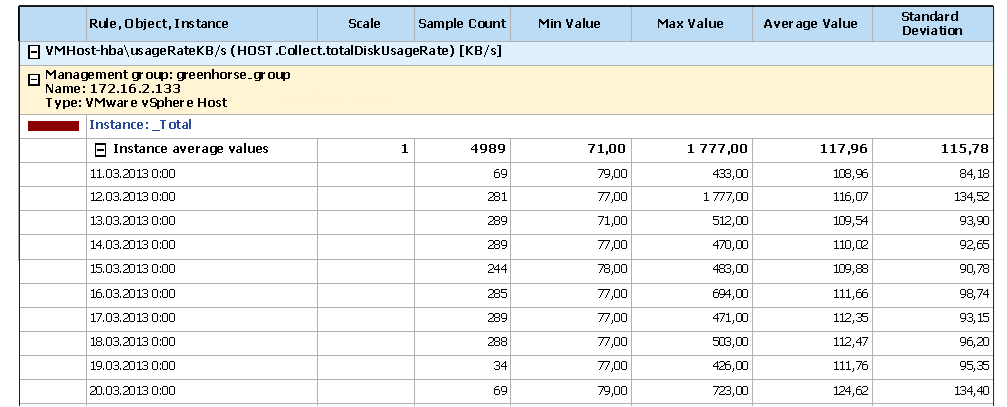
You can click the Instance: _Total link in the output table to drill down to the Veeam Performance Details Report from the Veeam Report Library.