Overriding a Veeam Analysis Monitor with ‘Top N’ Functionality
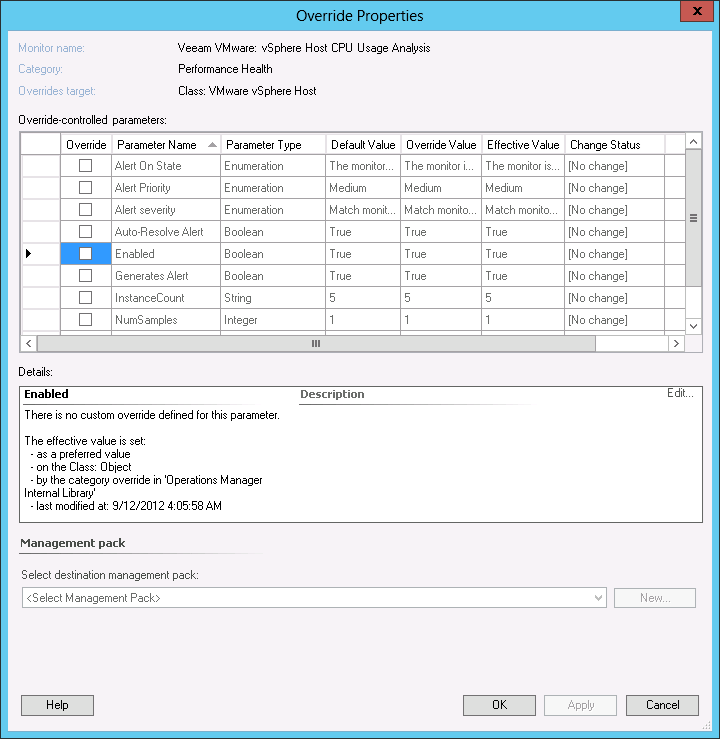
The example chosen here is Analysis Monitor Veeam VMware: vSphere Host CPU Usage Analysis. This monitor analyzes metric CPU Usage % for vSphere hosts. The monitor alert description will include not only the host CPU usage, but also the Top 5 virtual machines for real-time CPU usage on that host.
To override the monitor thresholds:
- In the OpsMgr console Authoring pane, select Management Pack Objects > Monitors.
- In the Look For box, search for ‘veeam’.
- From the list on the right pane, right-click the monitor under target ‘VMware vSphere Host CPU’, and from its shortcut menu select Overrides > Override the Monitor and then choose your desired scope, for example ‘for all objects of class: VMware vSphere Host’ to make the override global.
- Note the additional override parameter InstanceCount. This defines the number of Top N objects (in this case, VMs) that will be included in the alert description.
- Choose a Management Pack to store your overrides in (Microsoft Best Practice dictates a dedicated Overrides MP for each sealed MP), and click OK.
The monitor operates as follows:
- Two thresholds (Warning and Critical) are available.
- NumSamples parameter can be used to prevent alerting on single-sample spikes.
- The alert description is dynamically generated and also contains the Top N related/contained objects affecting the source metric.
Example alert output from this Top N Analysis Monitor is below:
Veeam VMware: vSphere Host CPU Usage Analysis | Alert Description | |
|---|---|---|
Source: | esx-prod2.veeam.local:CPU | The vSphere host esx-prod2.veeam.local has high CPU Usage with a value of 92.7% averaged over 2 sample(s). |
Full Path Name: | esx-prod2.veeam.local\esx-prod2.veeam.local:CPU | |
Alert Monitor: | Veeam VMware: vSphere Host CPU Usage Analysis | |
