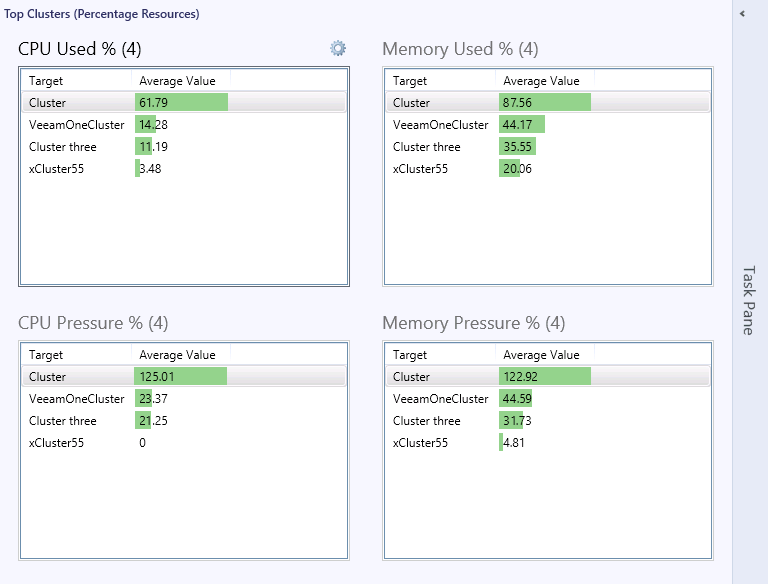
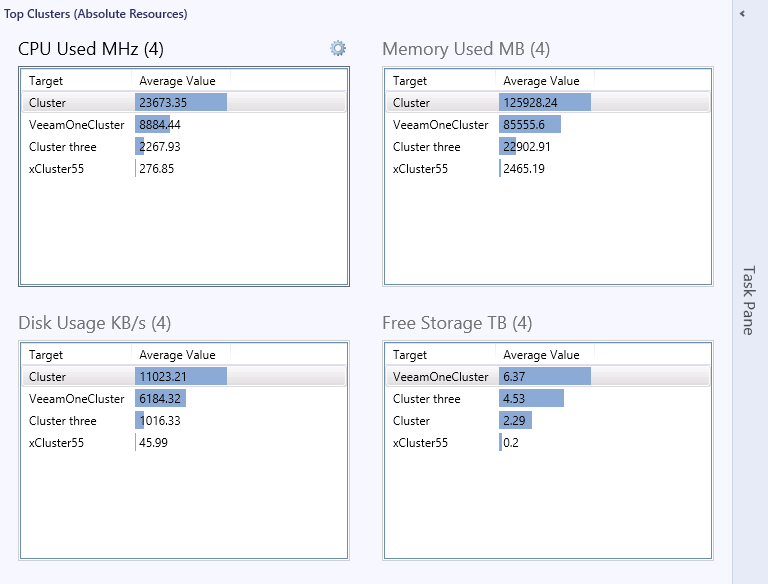
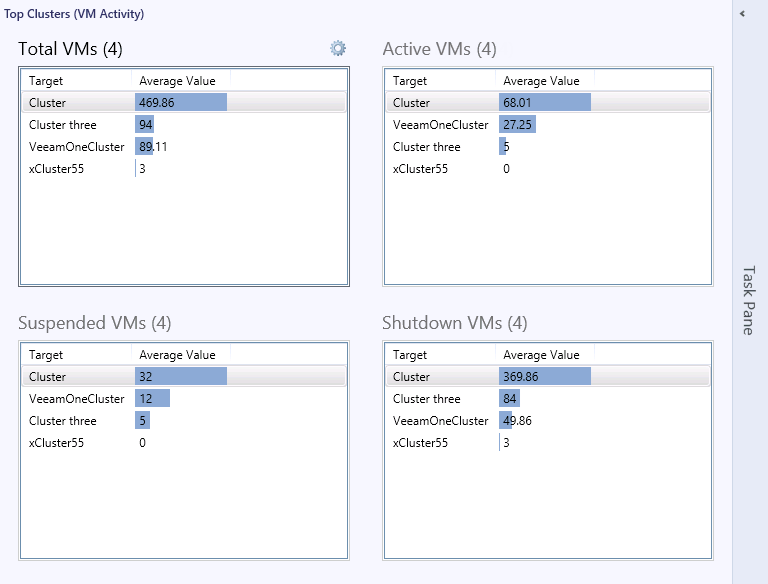
Top Clusters (Percentage Resources/Absolute Resources/VM Activity)
The Top Clusters dashboards can be launched from any view when a VMware vCenter Server or Datacenter object is selected.
- The Top Clusters (Percentage Resources) dashboard shows CPU usage and memory usage; and CPU pressure and memory pressure.
- The Top Clusters (Absolute Resources) dashboard shows CPU usage, memory usage, disk traffic, and available storage space.
- The Top Clusters (VM Activity) dashboard provides information on clusters that have the largest number of active, suspended, shutdown and total VMs.


