Analysis Dashboards
In-context Analysis Dashboards help you quickly drill down into the root cause of a problem and speed the troubleshooting process.
These dashboards can be launched directly from an open monitor alert (or any view in-context of the target object) and will allow you to analyze the metric history and related alerts for a specific vSphere performance area. The screenshot below shows a vSphere host alert (for CPU) selected — this makes the Analysis Dashboards for host scope available in the Navigation pane of the Tasks sidebar.
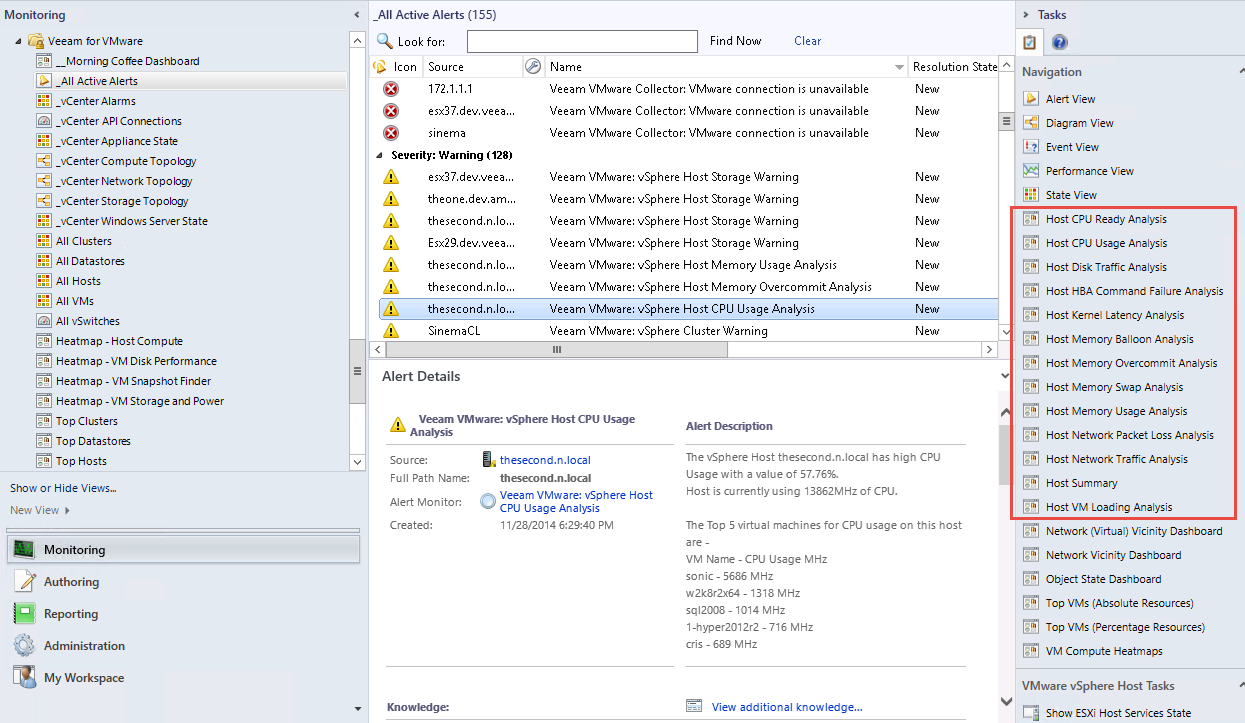
There are multiple Analysis Dashboards available, in-context for various vSphere objects. The Host CPU Usage Analysis Dashboard is shown below.
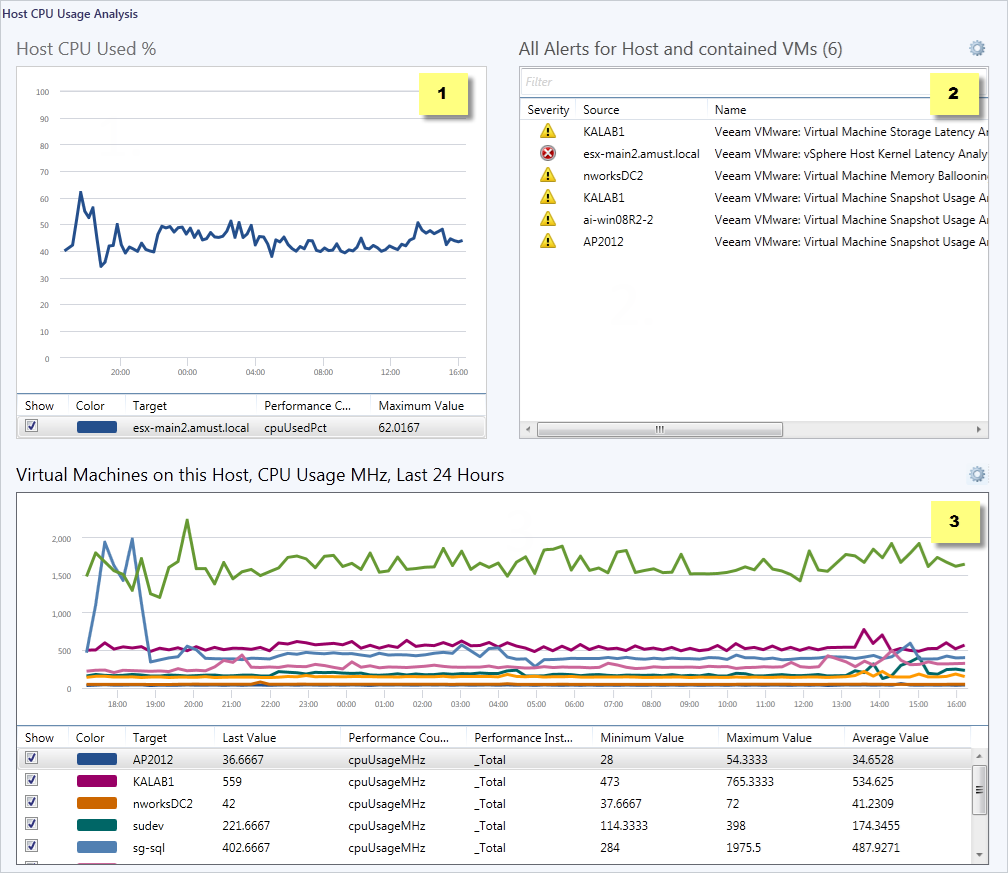
Every Performance Analysis Monitor has a matching Analysis Dashboard. In general the dashboard format follows the model in the screenshot above. The numbered panes show:
- Key metrics for the target object (in this example, vSphere host and CPU % Used)
- All alerts for the target object, and all contained objects (in this case, the vSphere host and all VMs running there)
- Key related metrics for the target or the contained objects (in this case, CPU Usage MHz for the VMs running on this host)
In This Section