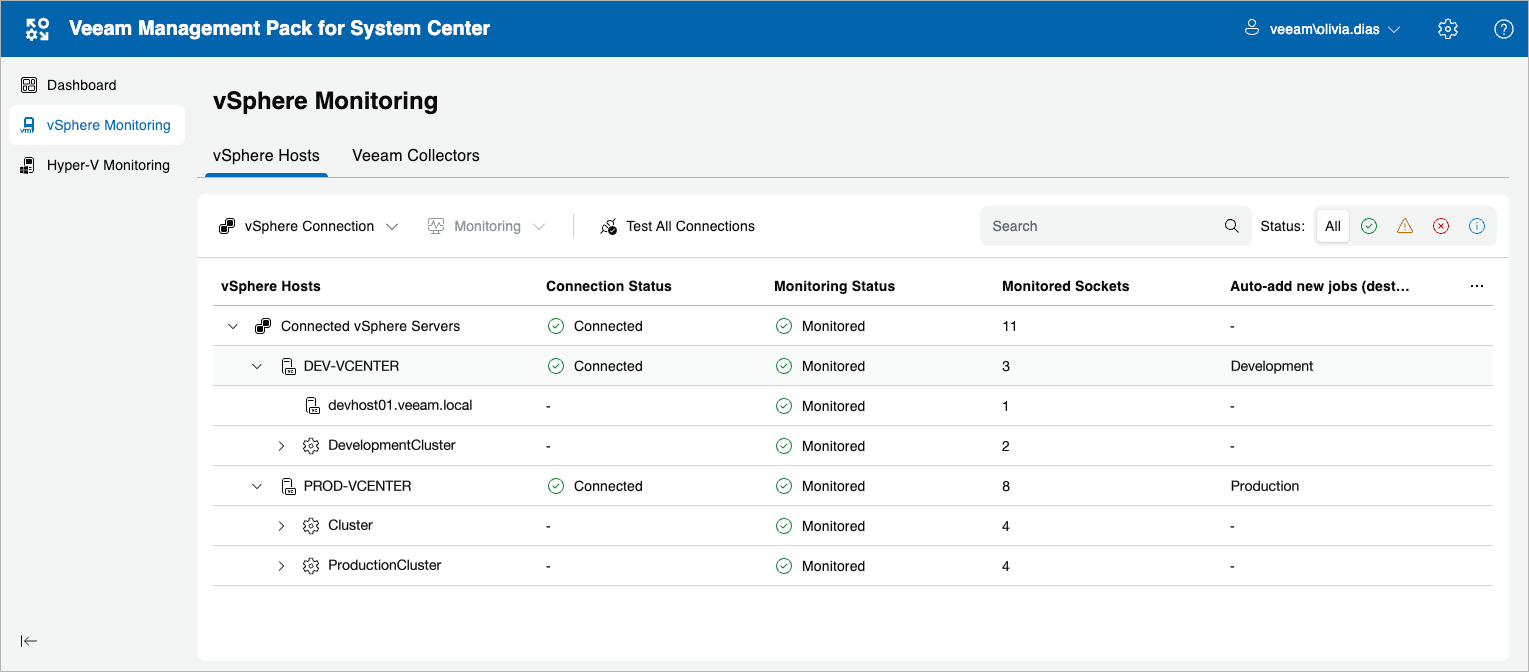
Step 12. Review vSphere Monitoring Tab
On the vSphere Monitoring tab, expand the Connected vSphere Servers tree to view information on the connected vCenter Servers. In this example, you will see:
- DEV-VCENTER, with 1 two-host cluster and 1 stand-alone host.
- PROD-VCENTER, with 2 clusters (total 5 hosts). Selecting nodes in the tree will display information in the details pane.
The vSphere Monitoring page displays connected vSphere resources. Each resource is represented with a set of properties, such as:
- Connection Status — the connection status of the vCenter Server or host.
- Monitoring Status — shows whether data collection is enabled for the resource.
Tip |
|
You can use this tab to exclude clusters or individual hosts from monitoring. To do that, select the necessary item and click Monitoring > Disable. This will disable the data collection for these systems, and they will not appear in OpsMgr. Socket licenses for the excluded hosts will be returned to the pool managed by the VE Service. |
- Monitored Sockets — the number of CPU sockets used for monitoring the object. Each monitored socket uses one socket license from the license pool.
- Auto-add New Jobs — shows whether new monitoring jobs are automatically added to a specific monitoring group.