Personalizing Heatmap Widgets
To change the default settings for a Heatmap widget:
- Open a Heatmap Dashboard.
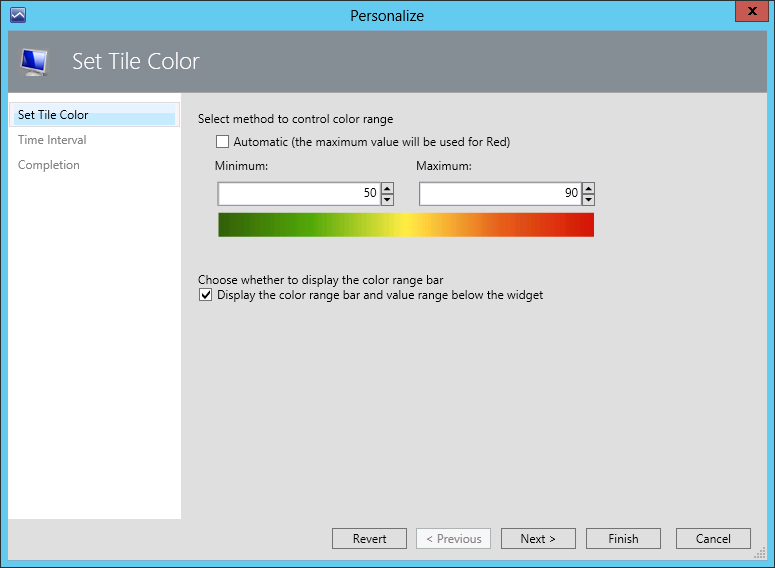
- Click the gear icon to the right of the necessary performance metric and select Personalize.
- Clear the Automatic (the maximum value will be used for Red) check box.
- Specify values for the Minimum and Maximum thresholds.
- Select the Display the color range bar and value range below the widget check box to show a legend bar with threshold below the heatmap.
- Click Finish.
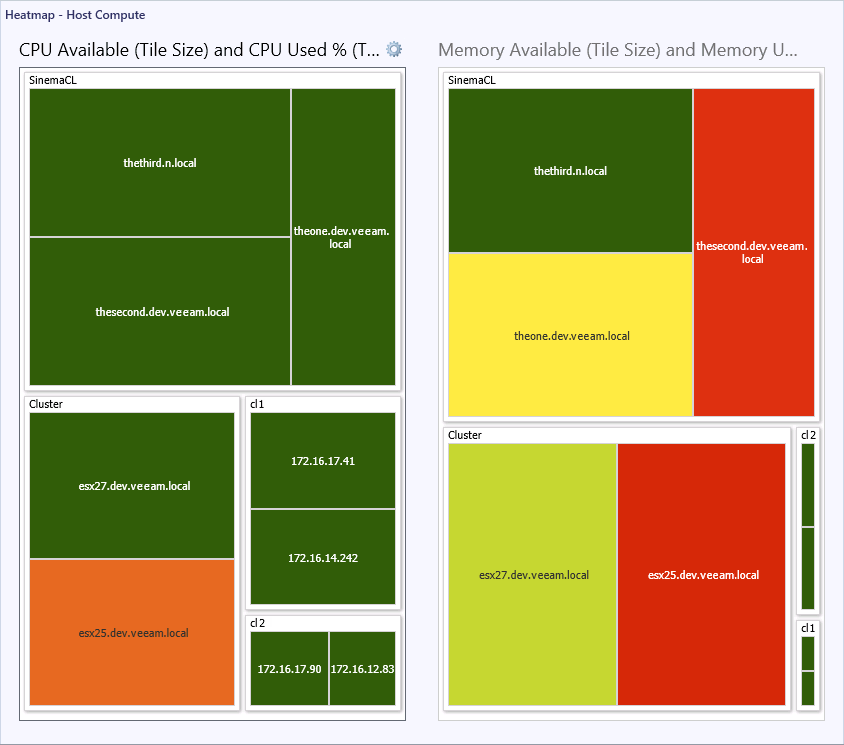
As a result, the object tiles on the heatmap will be highlighted as follows:
- If the Minimum threshold is breached, an object on the heatmap will be highlighted with Yellow.
- If the Maximum threshold is breached, an object on the heatmap will be highlighted with Red.
- If none of the thresholds is breached, an object on the heatmap will be highlighted with Green.
For example, the screenshot below shows the Heatmap - Host Compute dashboard with specified thresholds for CPU Available and CPU Used and Memory Available and Memory Used metrics.
To return back to the default widget settings, choose to personalize the widget and click Revert.