Advanced Visualizations
Unique dashboard views such as Heatmap and Traffic Lights give IT teams visibility of both “hotspots” and “dead zones” in the virtual environment.
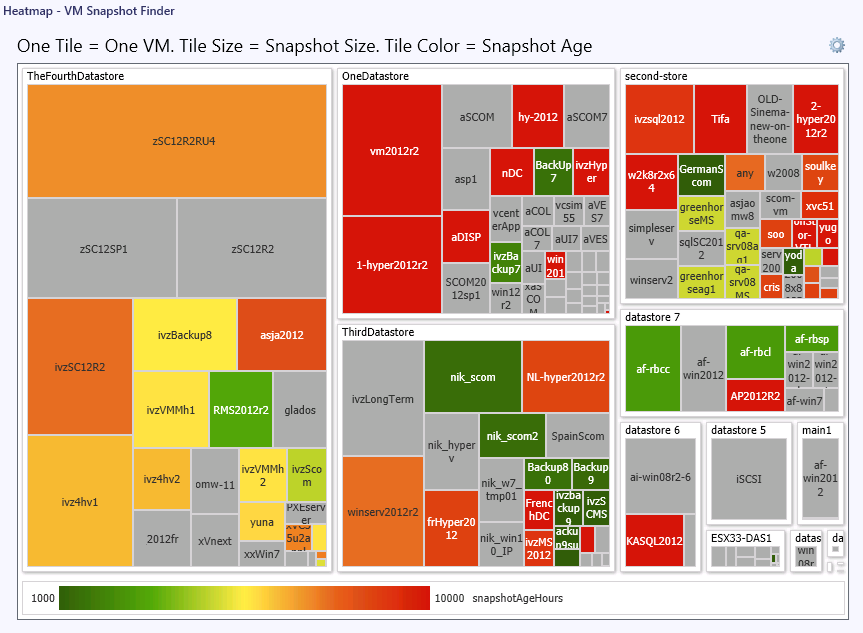
The following example shows the Heatmap – VM Snapshot Finder dashboard that displays data on used storage space and snapshot age for virtual machines.
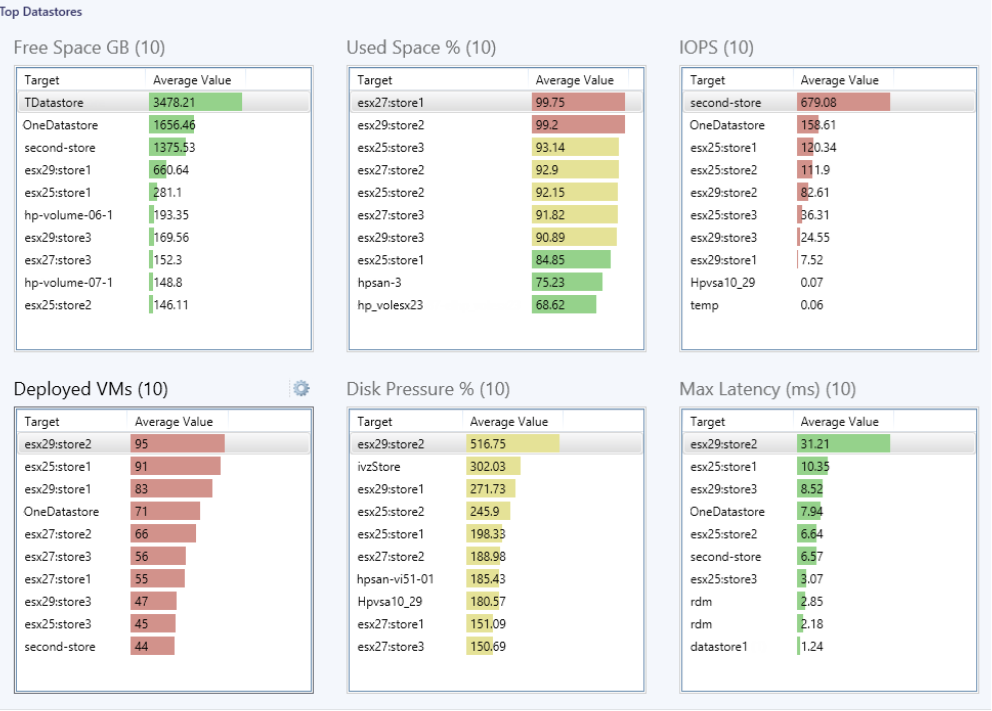
The following example shows the Top Datastores dashboard that uses the Traffic Lights feature to display storage status and identify datastores with performance issues.