Top Noisy vSphere Rules and Monitors
This report analyzes alerting activity and provides information on the most frequent alerts that occur in the virtual infrastructure across a time range.
Example Output
In this example, the report allows you to find out 10 most frequent alerts that were triggered for vSphere hosts during this week.
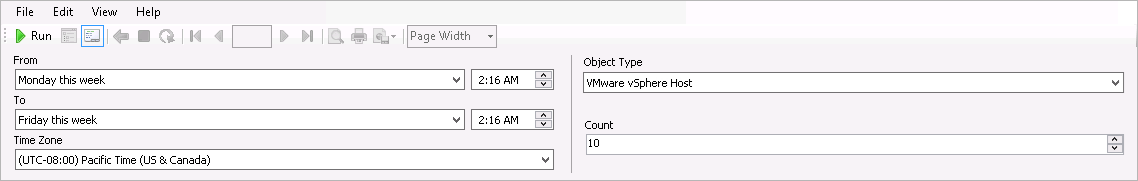
To run this report:
- From the From list, select This week > Monday. From the To list, select This week > Friday.
- From the Object Type list, select VMware vSphere Host.
- In the Count field, enter 10.
- Click Run to view the report.
The report will show statistics for top 10 host-related alerts that occurred most frequently during the week.
It can be seen from the report output below that the “Top Noisy” monitor of the week was the Veeam VMware: vSphere Host CPU Ready Time Analysis monitor since it triggered:
- 829 alerts in total (that is, 74% of all alerts included in the report)
- 280 alerts caused by the prod-esx1 host
- 271 alerts caused by the prod-esx3 host
- 265 alerts caused by the prod-esx2 host
- 9, 3 and 1 alerts caused by esx51-2.veeam.local, ahost.veeam.local and esx51-2.veeam.local hosts correspondingly.
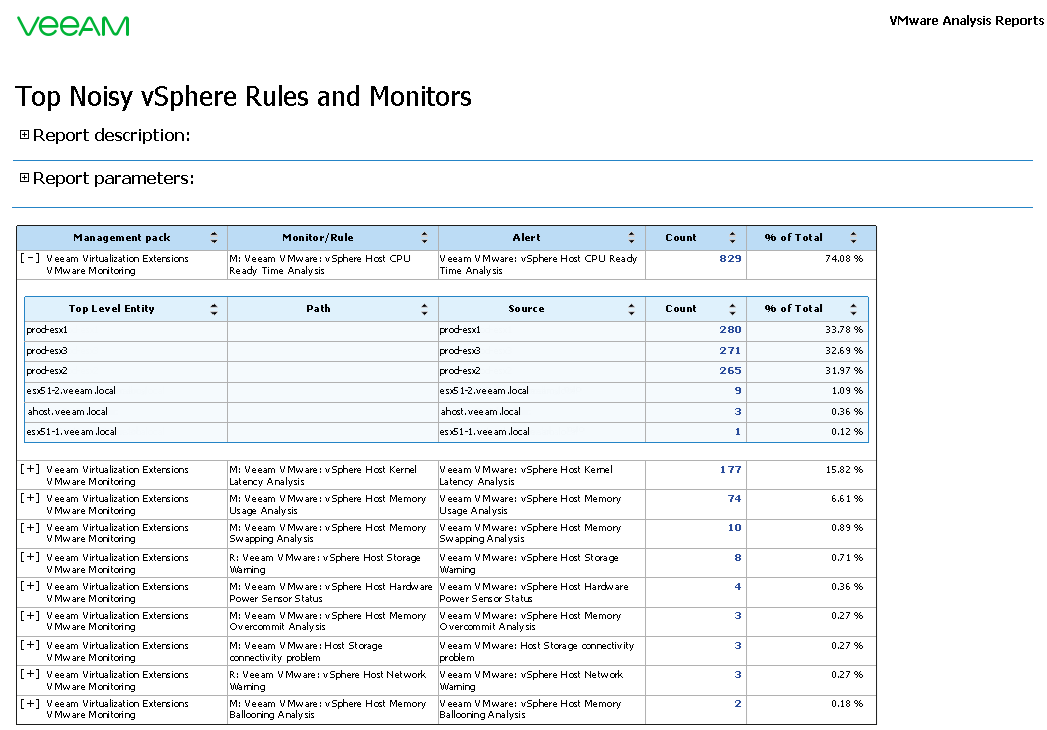
You can click a number in the Count column of the output table to drill down to the Veeam Alert History Report from the Veeam Report Library.