Performance Forecast for Datastores
This report forecasts how many days remain before the level of resource utilization reaches the specified threshold values. The report allows analyzing the following datastore resource utilization parameters: free space, provisioned space, read and write latency, disk IOPS.
If one or more specified thresholds are breached within the forecast interval, the report marks the datastore as problematic and lists constraining resources for it. The report also provides recommendations on appropriate resource allocation to prevent possible resource shortfalls in future.
Example Output
The report can be scoped at one or more datastores in your environment. In this example, the report forecasts number of days left before the amount of free space on the selected datastore reaches 20%. It also analyzes whether the amount of overprovisioned datastore space will reach the150% threshold.
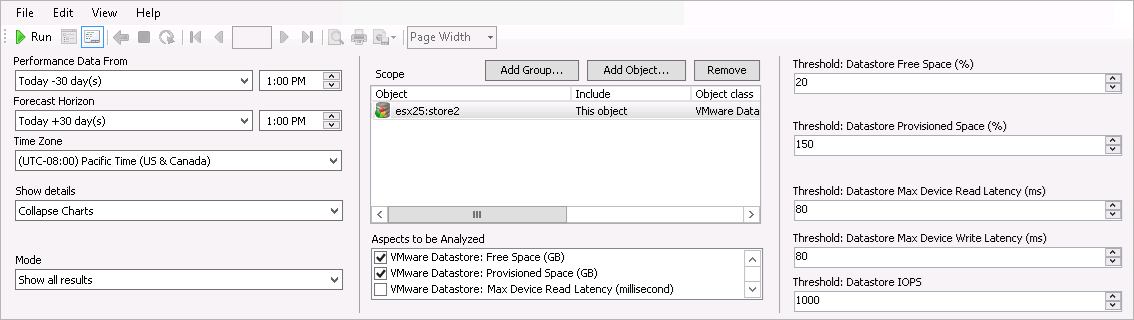
To run this report:
- From the Performance Data From list, select a day that dates back 30 days from now.
- From the Forecast Horizon list, select a date 30 days from today to define the forecast period.
- In the Scope section, select the datastore for which you want to make a prediction.
- From the Show details list, select Collapse Charts.
- From the Mode list, select Show all results.
- In the Threshold: Datastore Free Space (%) field, enter 20.
- In the Threshold: Datastore Provisioned Space (%), enter 150.
- In the Aspects to be Analyzed field, select VMware Datastore: Free Space (GB) and VMware Datastore: Provisioned Space (GB).
- Click Run to view the report.
The report will use historical performance data for the previous 30 days to analyze how the amount of free and provisioned space was changing. Next, it will apply the calculated free space trend to the forecast horizon and will detail how much space resources will be available in future.
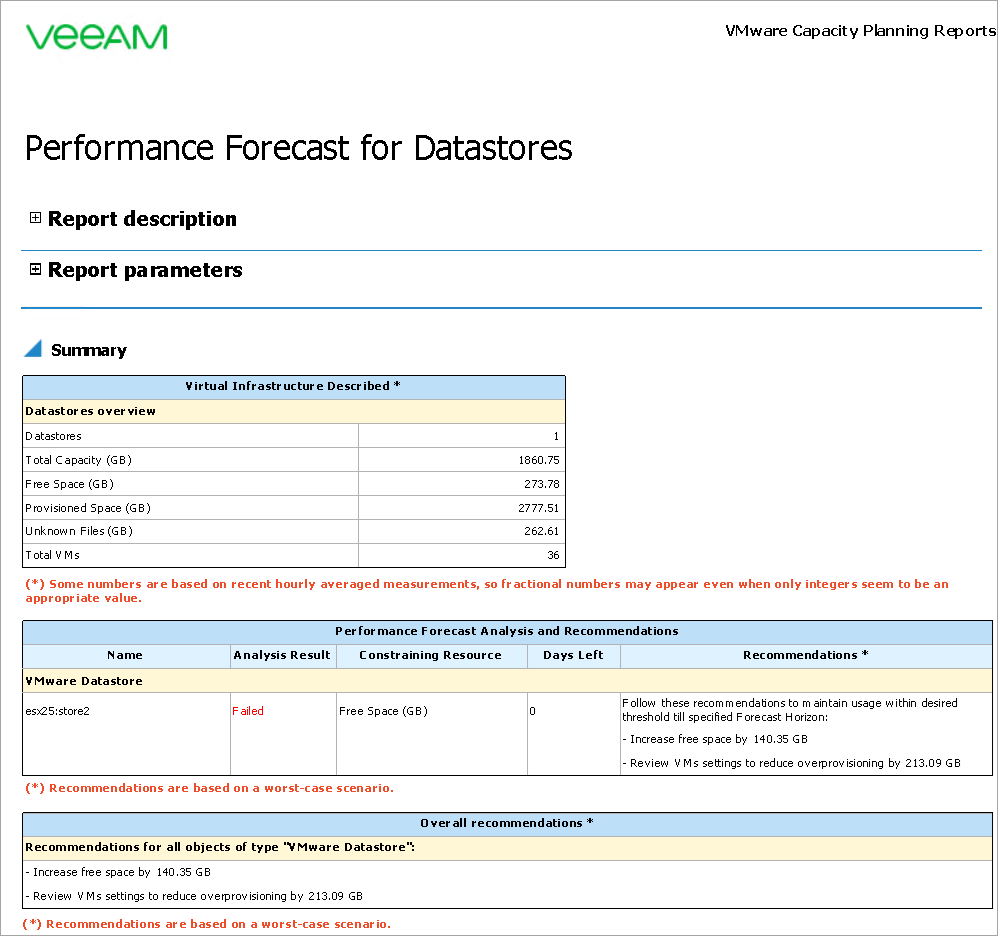
The Virtual Infrastructure Described table will provide an overview for the datastore included in the report scope: total capacity, amount of free and provisioned space, amount of space consumed by unknown files and the number of VMs residing on the datastores (note that this number will include both VMs and VM templates).
The Performance Forecast Analysis and Recommendations table will provide details and recommendations for the resource which utilization threshold will be breached first within the forecast period.
The Overall Recommendations table will provide recommendations for the datastore included in the report scope.
Further report details provide in-depth forecast information for the datastore.
The Virtual Infrastructure Described table will provide an overview for the datastore: total capacity, amount of free and provisioned space, amount of space consumed by unknown files and the number of VMs residing on the datastore (note that this number will include both VMs and VM templates).
The Performance Forecast section will show a chart and a details table for each analyzed datastore resource.
The performance forecast charts will display the following types of data series for the analyzed data collection period: resource utilization trend and the 95% confidence interval for it, historical performance data for the data collection period, the threshold specified for the datastore resource and total datastore capacity.
The Performance Forecast table reveals whether the specified thresholds will be breached and details the following forecasted values (all values are provided for both the best-case and the worst-case scenarios):
- Days Left: number of days after which free space and provisioned space thresholds will be breached
- Metric Forecast: predicted metric value at the end of the forecast period
- Available resources: amount of resources that will remain unused on the forecast horizon date (available resources, calculated as the difference between the threshold and the predicted resource usage)
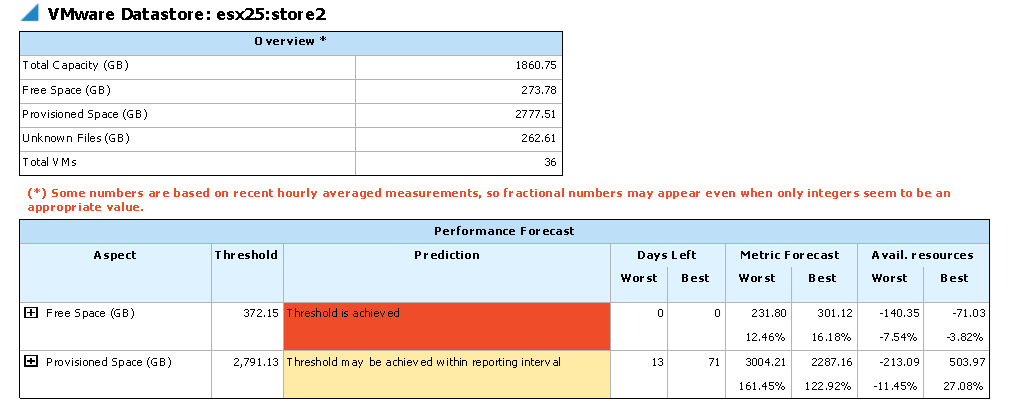
In this example, the datastore is forecasted to run low on free space resources. The number of Days Left shows 0, which means that the amount of free space on the datastore is already less than the threshold of 20%.
You can expand the table rows to open charts detailing actual space utilization values, calculated utilization trend and its deviation, resource capacity and the threshold.
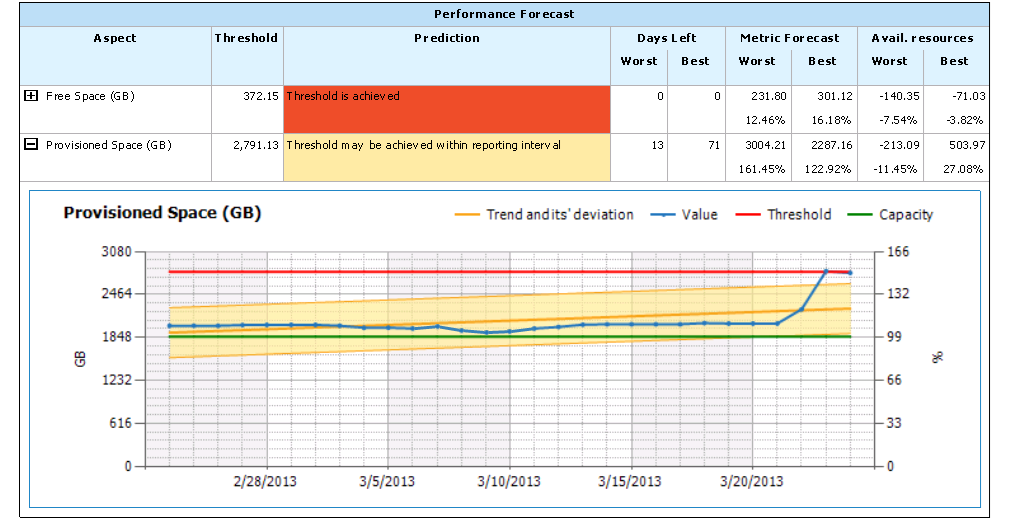
In this example, the report forecasts that the provisioned space threshold may be achieved within the next 13 days (in the worst-case scenario). The worst-case scenario is represented as the lower border of the yellow trend series on the chart. As seen from the example, the predicted worst-case provisioned space value in 13 days will be 161.45%. The predicted available space value in 13 days will be –11.45%, which means that the datastore will run out of provisioned space already before the forecast horizon date.
It also possible that provisioned space value reaches the threshold in 71 days (in the best-case scenario). The best-case scenario is represented as the upper border of the yellow trend series on the chart. As seen from the example, the predicted best-case provisioned space value in 71 days will be 122.92%. The amount of available resources is negative, which means that on the forecast horizon date there will be even less provisioned space resources than 20%.