Virtual Machines. Idle VMs
Idle VMs are virtual machines that remain running even though they are no longer used, for example the project or POC is complete — but the virtual machines were never decommissioned. These Idle (aka 'Zombie') VMs consume CPU, memory and storage resources that could be used by other active machines.
The Virtual Machines. Idle VMs report shows a list of idle VMs in terms of CPU, memory, disk and network utilization.
Example Output
In this example, the report on CPU and memory performance has been run to identify VMs that can be considered as candidates for powering off or decommissioning. The report also allows you to identify VMs that stayed idle longer than the half of the reporting period.
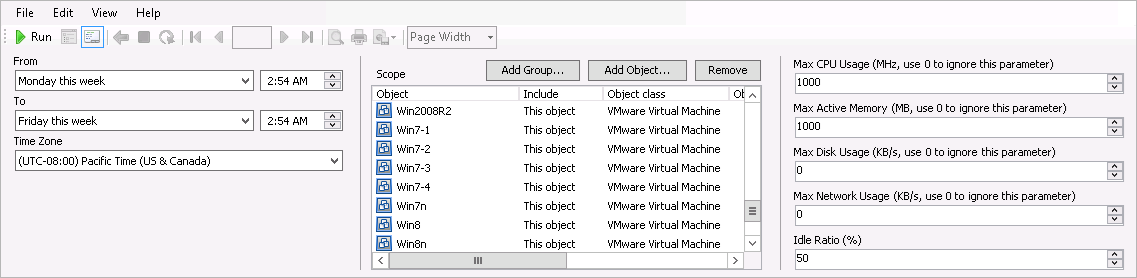
To run this report:
- From the From list, select This week > Monday. From the To list, select This week > Friday.
- In the Scope section, include the necessary virtual machines in the report.
- In the Max CPU usage (MHz) and Max Active Memory (MB) fields, enter 1000. Do not change other threshold values.
- In the Idle Ratio (%) field, enter 50.
- Click Run to view the report.
Note |
With default data grooming and aggregation settings, the current date may not have a datapoint in the data warehouse. In this case, the object will be marked Unmonitored for the current day, which means the object will have downtime. For more accurate reporting results, you can exclude the current day from the reporting period. |
The report will show the list of virtual machines that stayed idle longer than half of the reporting period. Particularly, these are VMs whose maximum CPU usage was reported below 1000 MHz, and maximum memory usage way reported below 1000 Mb for at least 3 days of the week.
The Summary doughnut charts will show the following information:
- Total number of idle, switched-off and normal VMs (“normal” are VMs that are neither idle, nor switched-off): it can be seen from the output below, that during the week there were only 6 idle VMs, 15 normal and 28 switched-off
- Total CPU, memory, network and disk usage for idle and normal VMs
- Total storage consumption for idle and normal VMs: in this example, idle VMs consumed 52 GB, normal VMs — 553 GB, and switched-off VMs — 562 GB.

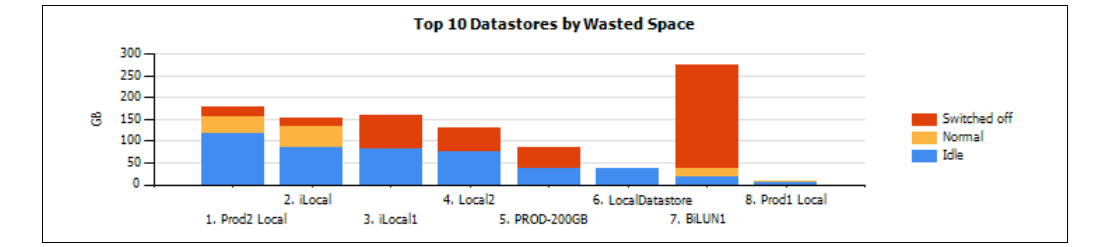
The Top 10 Datastores by Wasted Space chart will show 10 datastores with the highest amount of storage consumed by idle, switched-off and normal VMs.
In this example, datastore #7 had the highest amount of storage consumed by switched-off VMs, datastore #1 had the highest amount of storage consumed by idle VMs, and datastore #2 had the highest amount of storage consumed by normal VMs.
The details table will show the following information for idle VMs: CPU, disk and network usage, active memory, percentage of time when the VM was in the idle state (that is, idle ratio), percentage of time when the VM was in the Critical state (Critical state means that the VM was powered off or non-operating) and storage space allocated.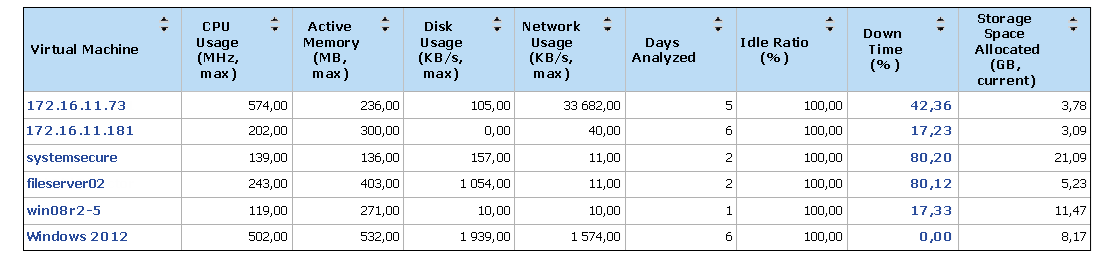
You can click a VM name in the report table to analyze how the amount of consumed CPU, memory, network and storage resources was changing for the VM during the week.
You can also click the link in the Down Time (%) column to drill down to uptime details for the VM for this week.