Traffic Light Widget
This widget shows top or bottom infrastructure objects for the selected performance metric.
Sample Usage
This section provides step-by-step instructions that will help you understand how to use the Traffic Light widget. Consider the following example:
You need to analyze the number of running VMs on hosts and make sure this number does not exceed 15.
In a dashboard, click to add a new widget and follow the next steps:
- At the Template step, choose Veeam > Veeam Traffic Light Widget.
- At the General Properties step, specify widget display name and description.
- At the Scope and Counters step, choose what infrastructure objects will be included in the widget scope and what counter should be analyzed:
- In the Select a group or object field, choose the VMware vSphere Hosts.
- In the Select a performance counter (Object/ Counter/ Instance) field, choose VMHost / vmActive / _Total.
- At the Time Range and Results step, leave the default interval settings.
- At the Display step, specify traffic lights color settings.
Select the Use warning (yellow) and critical (red) thresholds for the bar color check box. In the Warning field, type 10; in the Critical field, type 15.
- Click Create.
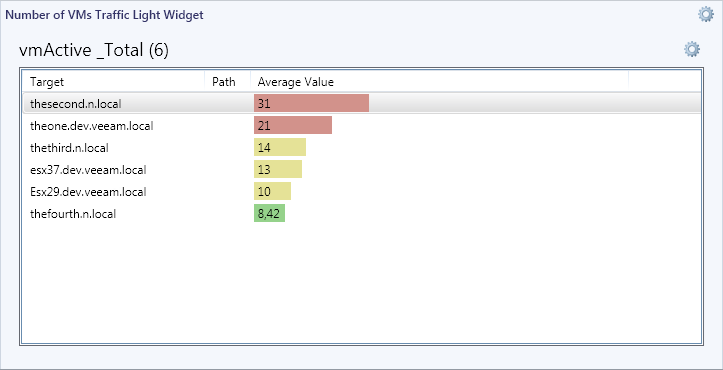
As a result, the widget will show hosts sorted by running VMs:
- Hosts with more than 15 VMs will be highlighted with Red
- Hosts with 10 to 15 running VMs will be highlighted with Yellow
- Hosts with less than 10 running VMs will be highlighted with Green
Veeam MP for VMware also allows you to configure the thresholds for predefined Top dashboards. For details, see Top Dashboards.