 This is an archive version of the document. To get the most up-to-date information, see the current version.
Viewing Plan Execution History
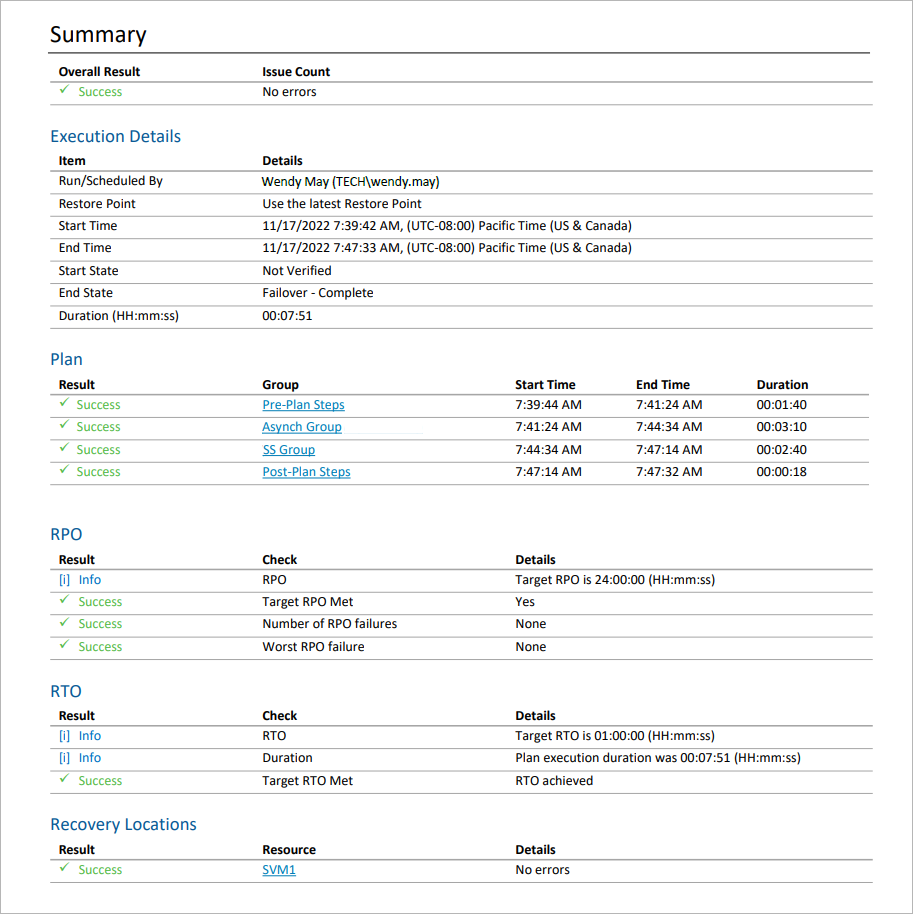
For each executed orchestration plan (that is, upon transition from one stable state to another), Orchestrator will generate the Plan Execution Report. The report contains plan performance details and provides information on each processed machine and any errors encountered during plan execution.
To access the report for an orchestration plan:
- Navigate to Orchestration Plans.
- Select the plan.
- From the Reports menu, choose Execution.
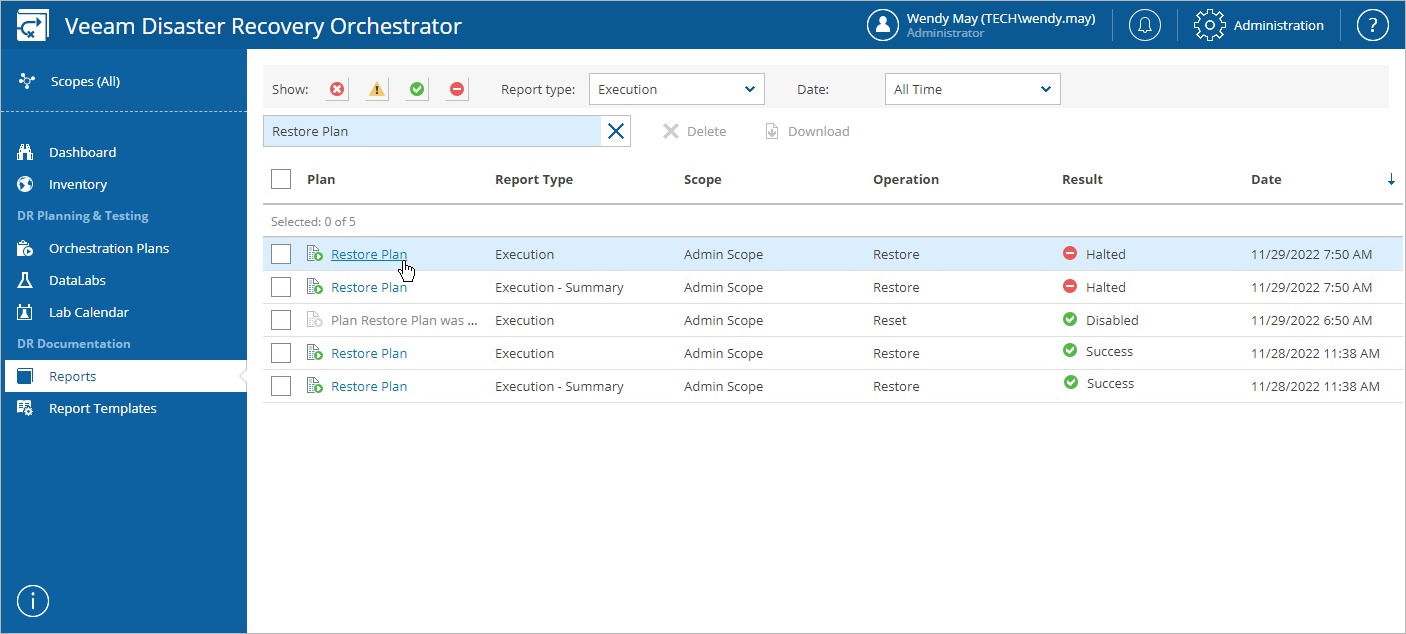
The Reports page will be displayed. The Show Execution reports option will be automatically enabled to list all available Plan Execution Reports for the plan.
- Click the report name to download and open the Plan Execution Report.
The Plan Execution Report will use the default report template or a custom template. After the template pages, the results of plan execution will be appended.
By default, Orchestrator generates two types of reports:
- A summary report that includes a plan overview, summary of inventory groups included in the plan, with drill-down hyperlinks to specific machines and color-coded results of processing every plan step.
- A full report that also includes information on specific steps that will run during the recovery process. For every group, machine and step included in the plan, the processing start time and duration will be recorded.
To minimize the load on the server and filter the report output, you can specify the report detail level as described in section Configuring Report Options.
Tip |
Summary information on plan execution results over all Orchestrator scopes will be also available on the Home Page Dashboard. |