Veeam Monitoring
The Veeam Monitoring dashboard displays aggregated information about jobs related to your Veeam Backup & Replication servers. Specific widgets also display event statistics.
|
Note |
|
Consider the following:
|
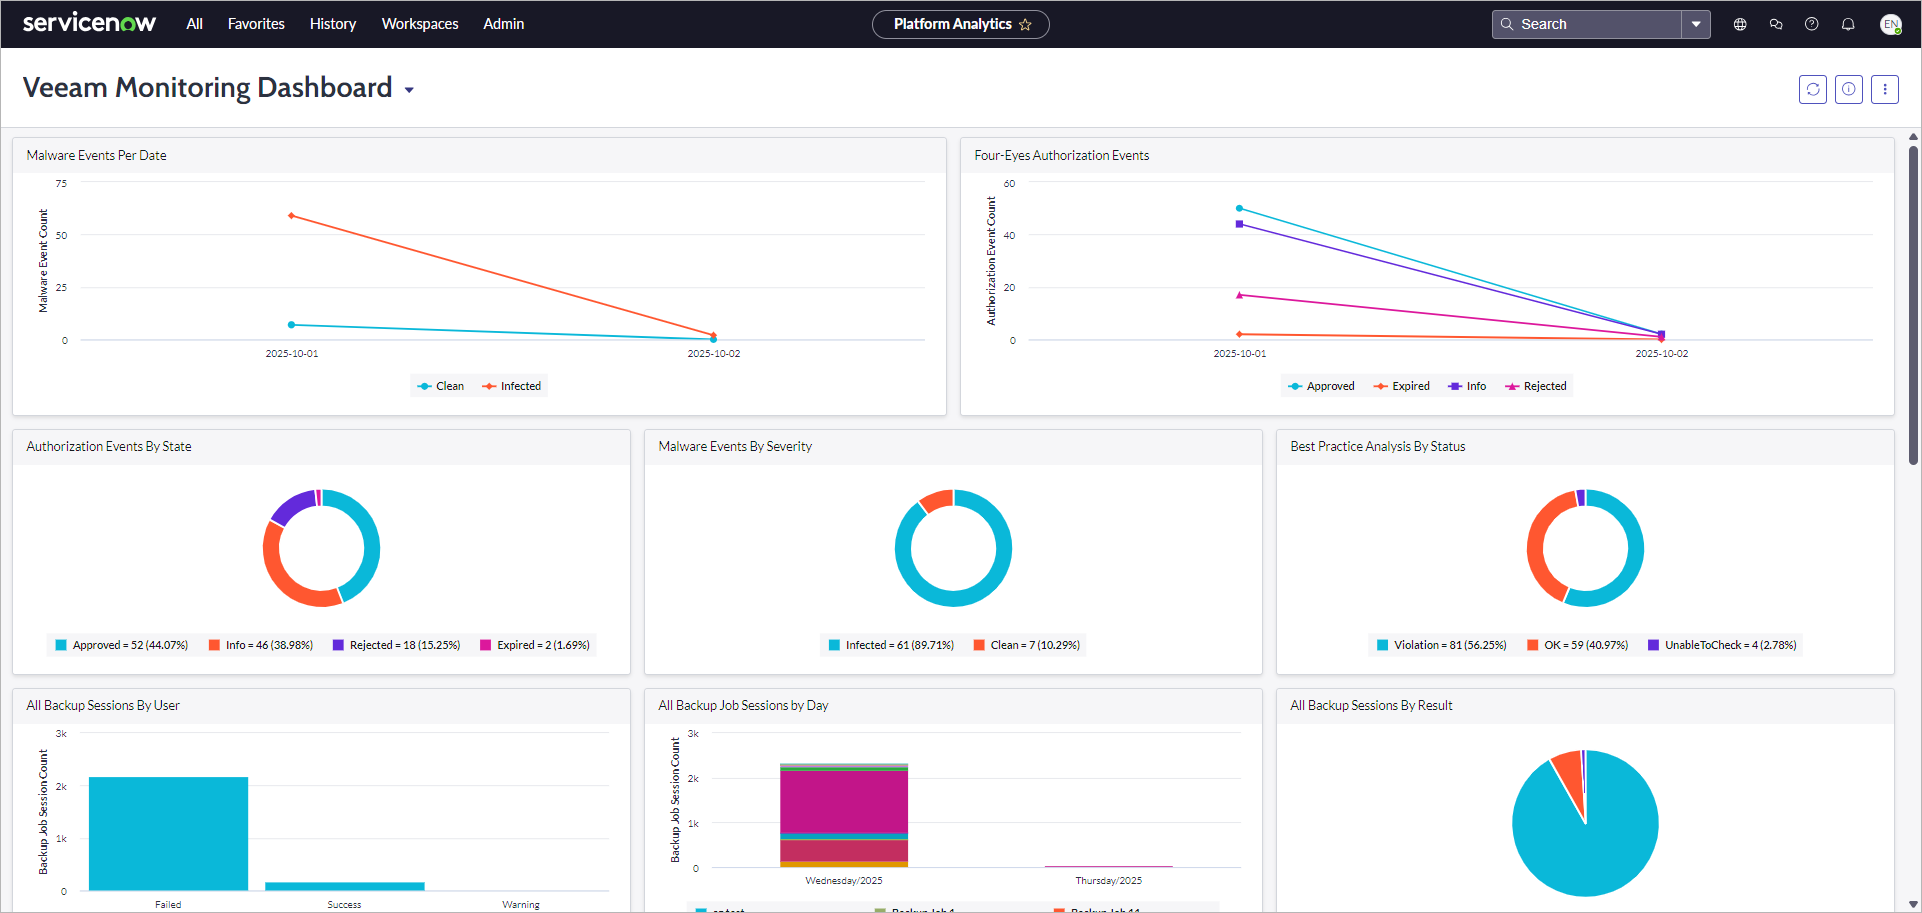
The dashboard includes the following widgets:
|
Widget |
Description |
|---|---|
|
Malware Events Per Date |
A colored graph displaying the breakdown of malware events per date. By default, the widget displays data for the last 7 days. |
|
Four-Eyes Authorization Events |
A colored graph displaying the breakdown of four-eyes authorization events per date. By default, the widget displays data for the last 7 days. |
|
Authorization Events By State |
A pie chart displaying the breakdown of four-eyes authorization events by state. By default, the widget displays data for the last 30 days. |
|
Malware Events By Severity |
A pie chart displaying the breakdown of malware events by severity level. By default, the widget displays data for the last 30 days. |
|
Best Practice Analysis By Status |
A pie chart displaying the breakdown of Security & Compliance Analyzer scan results by status. By default, the widget displays data for the last 30 days. |
|
All Backup Sessions By User |
A colored stacked bar chart displaying the breakdown of job sessions by user. By default, the widget displays data for the last 30 days. |
|
All Backup Sessions By Day |
A colored stacked bar chart displaying the breakdown of job sessions by day. By default, the widget displays data for the last 30 days. |
|
All Backup Sessions By Result |
A pie chart displaying the breakdown of job sessions by state. By default, the widget displays data for the last 30 days. |
|
All Unstructured Job Sessions Per User |
A colored stacked bar chart displaying the breakdown of file backup job sessions per user. By default, the widget displays data for the last 30 days. |
|
All Unstructured Job Sessions By Day |
A colored stacked bar chart displaying the breakdown of file backup job sessions by day. By default, the widget displays data for the last 30 days. |
|
All Unstructured Job Sessions By Result |
A pie chart displaying the breakdown of file backup job sessions by state. By default, the widget displays data for the last 30 days. |
|
All High Events |
The total amount of application events with the High severity level. By default, the widget displays data for the last 24 hours. |
|
All Application Events By Risk Level |
A pie chart displaying the breakdown of application events by severity level. By default, the widget displays data for the last 30 days. |
|
All Application Events By Type |
A colored stacked bar chart displaying the breakdown of application events by type. By default, the widget displays data for the last 30 days. |
To view detailed information on specific data, click a value on a widget. A table with filtered results will be opened.