My Events
The My Events dashboard displays aggregated information about operations with app resources the user performs in Veeam App for ServiceNow. The data is filtered according to the user role and location scope and shows only operations initiated by the current user. For more information about app roles, see Configuring Users and Roles.
|
Note |
|
Consider the following:
|
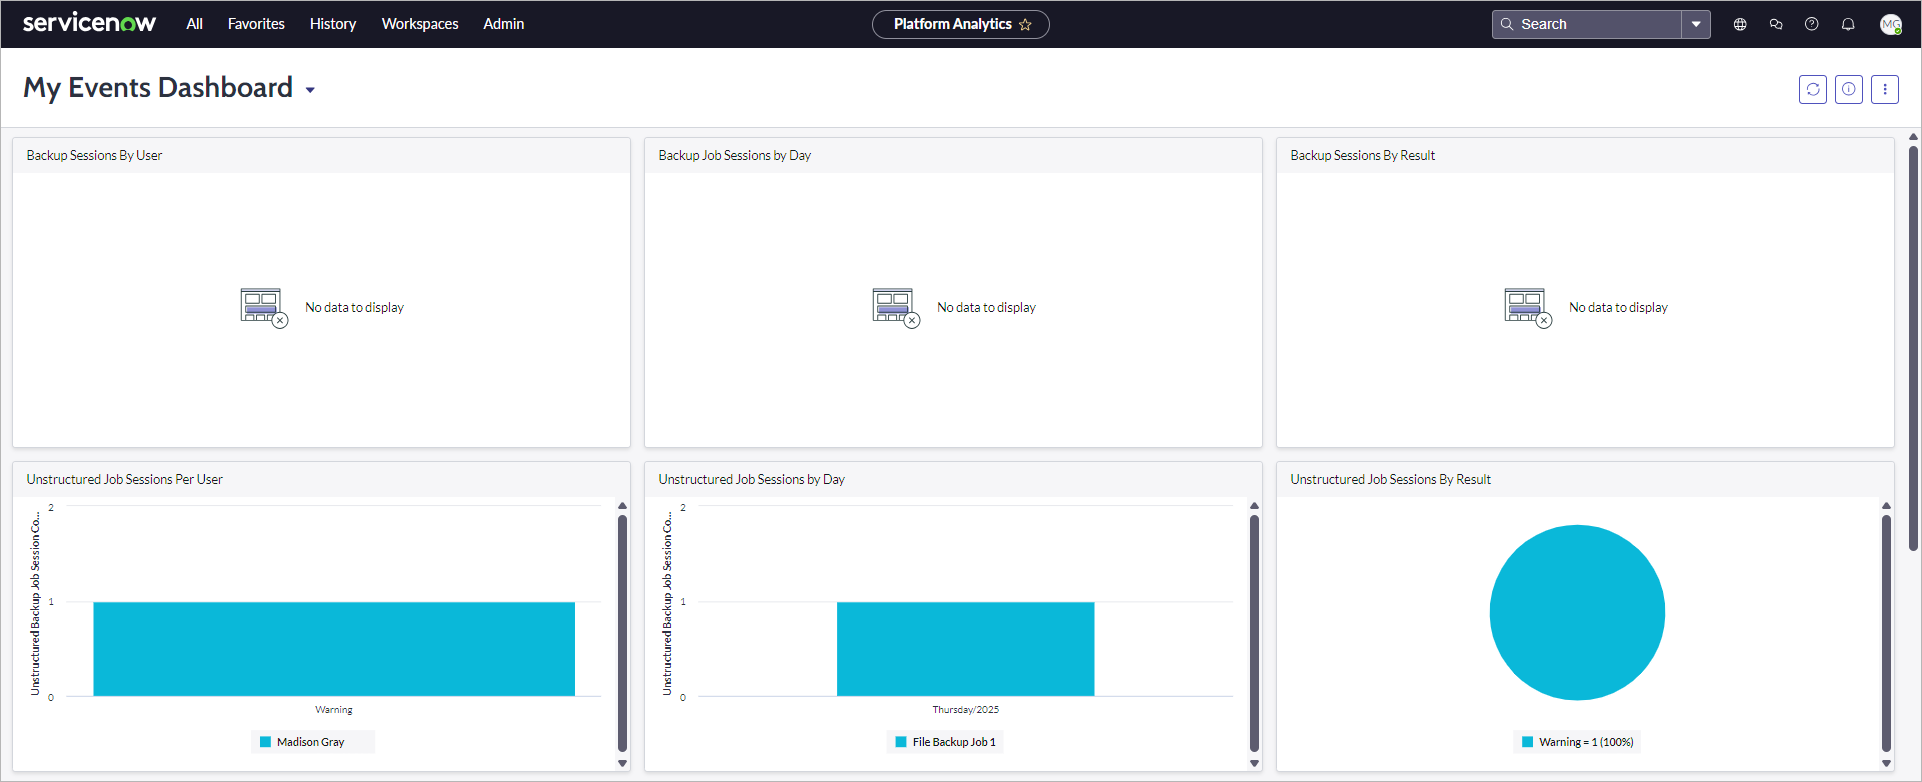
The dashboard includes the following widgets:
|
Widget |
Description |
|---|---|
|
Backup Sessions By User |
A colored stacked bar chart displaying the breakdown of job sessions by user. By default, the widget displays data for the last 30 days. |
|
Backup Sessions By Day |
A colored stacked bar chart displaying the breakdown of job sessions by day. By default, the widget displays data for the last 30 days. |
|
Backup Sessions By Result |
A pie chart displaying the breakdown of job sessions by state. By default, the widget displays data for the last 30 days. |
|
Unstructured Job Sessions Per User |
A colored stacked bar chart displaying the breakdown of file backup job sessions per user. By default, the widget displays data for the last 30 days. |
|
Unstructured Job Sessions By Day |
A colored stacked bar chart displaying the breakdown of file backup job sessions by day. By default, the widget displays data for the last 30 days. |
|
Unstructured Job Sessions By Result |
A pie chart displaying the breakdown of file backup job sessions by state. By default, the widget displays data for the last 30 days. |
|
High Events |
The total amount of application events with the High severity level. By default, the widget displays data for the last 24 hours. |
|
Application Events By Risk Level |
A pie chart displaying the breakdown of application events by severity level. By default, the widget displays data for the last 30 days. |
|
Application Events By Type |
A colored stacked bar chart displaying the breakdown of application events by type. By default, the widget displays data for the last 30 days. |
To view detailed information on specific data, click a value on a widget. A table with filtered results will be opened.