
The Hyper-V Datastores dashboard provides at a glance view on resource usage and performance of disks and Cluster Shared Volumes in the Hyper-V environment. The dashboard helps you assess disk capacities and prevent potential performance bottlenecks.
Widgets Included
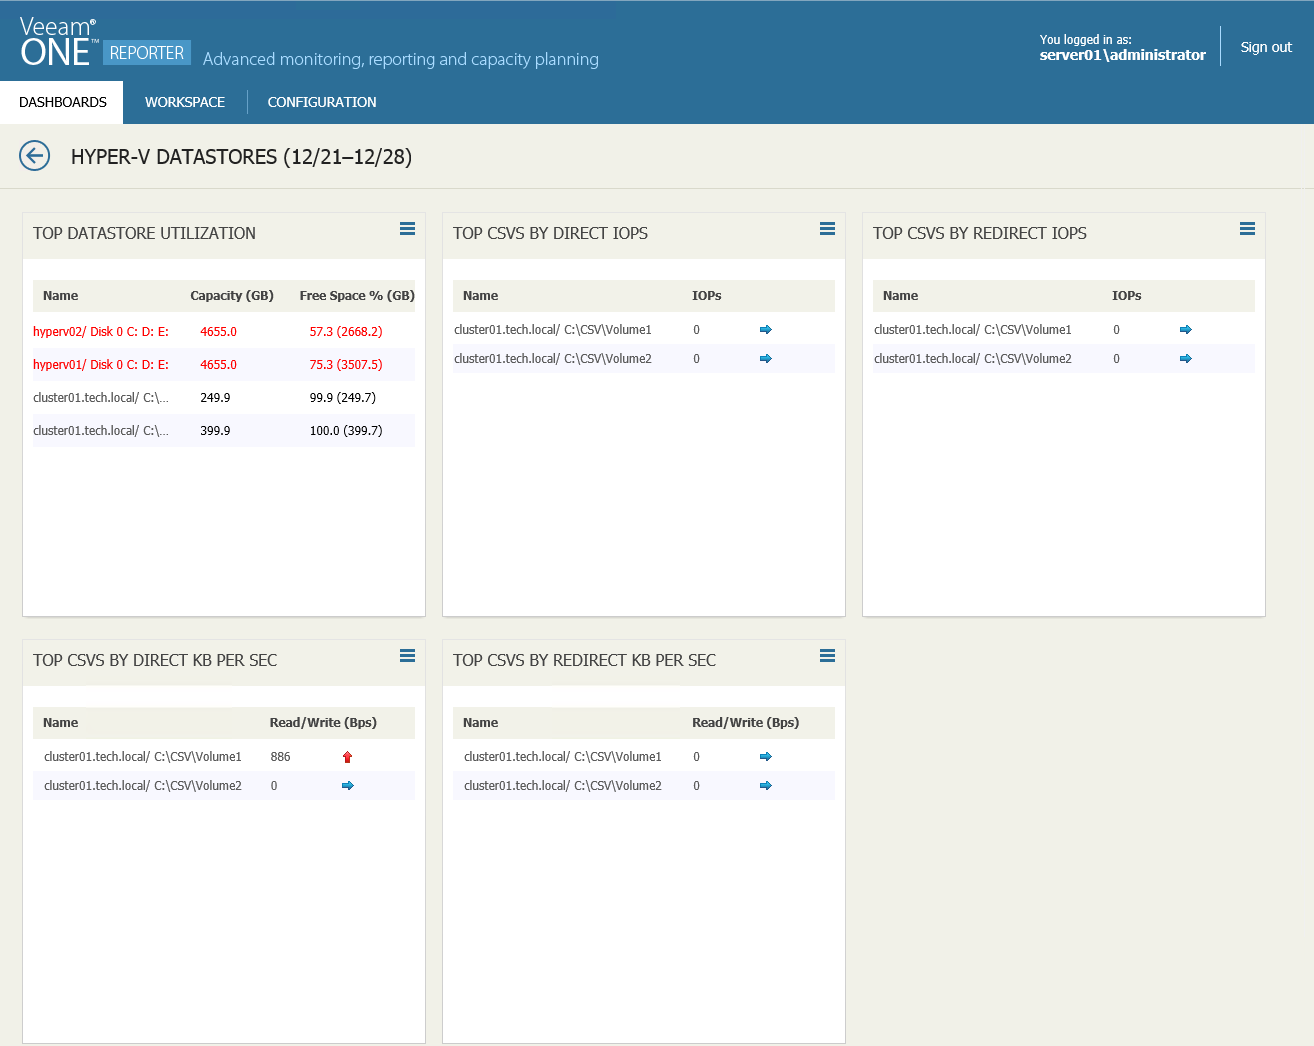
- Top Datastore Utilization
This widget displays a list of disks that will run out of free space sooner than other disks.
Values in parentheses show free space values for the previous week.
- Top CSVs Direct IOPS
This widget displays a list of Cluster Shared Volumes with the highest number of I/O operations performed in the direct access mode.
Arrows on the right show whether the number of IOPS has changed over the previous week*.
- Top CSVs Redirected IOPS
This widget displays a list of Cluster Shared Volumes with the highest number of I/O operations performed in the redirected access mode.
Arrows on the right show whether the number of IOPS has changed over the previous week*.
- Top CSVs Direct KB per Sec
This widget displays a list of Cluster Shared Volumes with the highest rate at which bytes were transferred to/from the CSV during write/read operations in the direct access mode.
Arrows on the right show whether the Direct Bytes/sec metric value has changed over the previous week*.
- Top N CSVs Redirected KB per Sec
This widget displays a list of Cluster Shared Volumes with the highest rate at which bytes were transferred to/from the CSV during write/read operations in the redirected access mode.
Arrows on the right show whether the Redirected Bytes/sec metric value has changed over the previous week*.
*The arrow allows you to compare the results of the current week to the results of the previous week, and to track how the trend has evolved. For example, a blue arrow pointing right next to the IOPS value means that the average number of IOPS has not changed over the past week, a green arrow pointing down means that the average number of IOPS has decreased, while a red arrow pointing up means that the average number of IOPS has increased.
