This is an archive version of the document. To get the most up-to-date information, see the current version.
Reviewing Dashboard
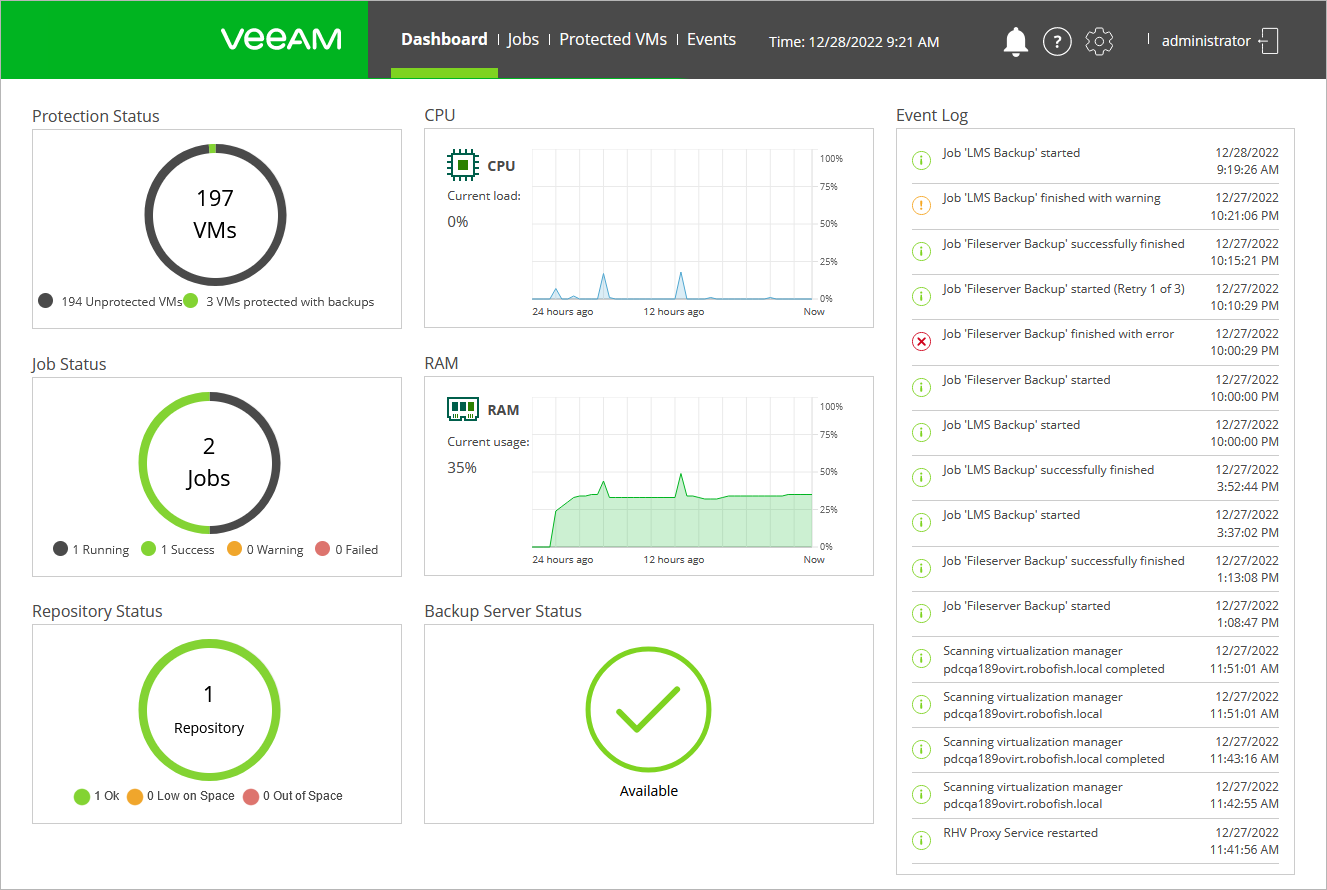
Veeam Backup for RHV comes with a dashboard that provides at-a-glance real-time overview of the protected RHV resources and allows you to estimate the overall backup performance. The dashboard includes the following widgets:
- Protection Status — displays the number of unprotected VM and VMs that are protected with backups created by Veeam Backup for RHV. To get the list of protected VMs, click the widget.
- Repository Status — displays the number repositories to which the RHV backup proxy has access. The widget also shows the amount of storage space that is currently free in each repository. If less than 15% of storage space is free, a repository is low on space. If less than 5% of storage space is free, a repository is out of space.
- Job Status — displays the number of job runs during the past 24 hours. To switch to the Jobs page, click the widget.
- The CPU widget analyzes the amount of backup proxy CPU resources used for processing jobs during the past 24 hours.
- The RAM widget shows memory consumption on the backup proxy during the past 24 hours.
To monitor the availability of compute resources on the backup proxy, you can instruct Veeam Backup for RHV to send you notifications if the memory usage or available CPU drops below the configured threshold. For more information, see section Configuring Notifications.
- Backup Server Status — indicates whether connection to the backup server is successfully established.
- Event Log — displays recent logs of the RHV backup proxy. To view the full list of logs, switch to the Events page.