 This is an archive version of the document. To get the most up-to-date information, see the current version.
Hyper-V Custom Performance
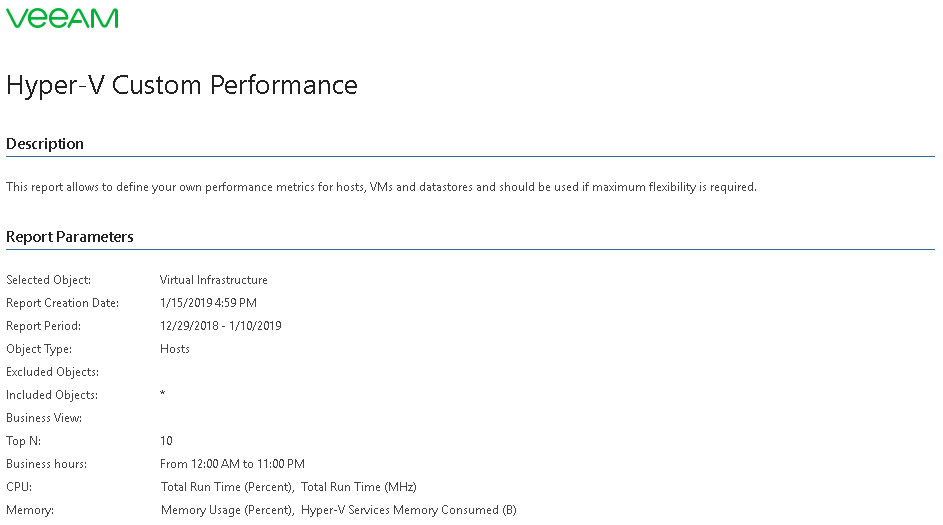
This report allows you to define specific CPU, memory, network and disk metrics to analyze performance of Hyper-V hosts, VMs, Cluster Shared Volumes and SMB shares.
Use Case
Use this report to investigate specific performance issues in the environment.
Report Parameters
You can specify the following report parameters:
- Scope: defines a virtual infrastructure level and its sub-components to analyze in the report.
- Business View objects: defines Veeam ONE Business View groups to analyze in the report.
- Interval/Period/Start Date - End Date: defines the time period to analyze in the report. Note that the reporting period must include at least one data collection session for the selected scope. Otherwise, the report will contain no data.
- Object Type: defines the infrastructure object to analyze in the report (Hosts, Virtual Machines, Local Datastore, CSV 2008, CSV, SMB Shares).
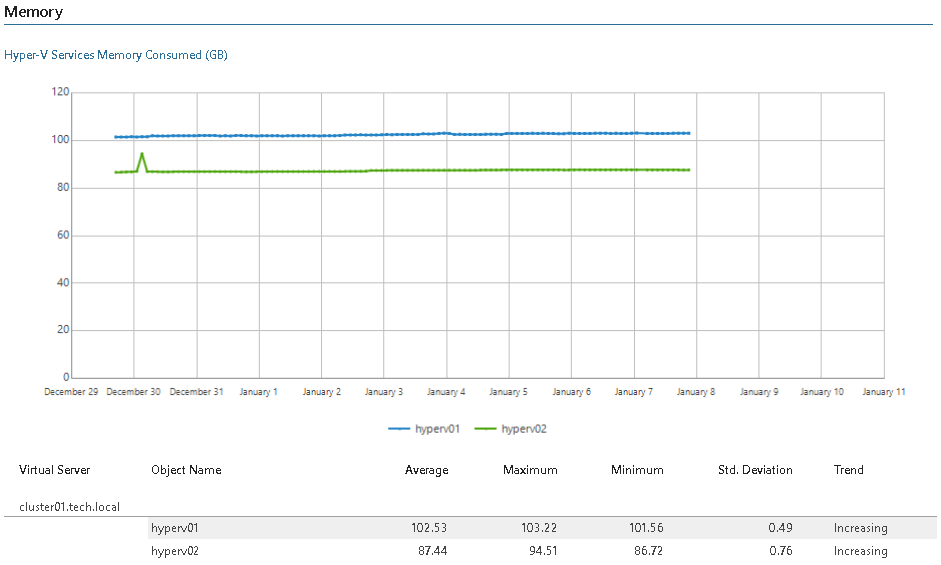
- Monitor Subsystems: defines subsystems to analyze in the report (CPU, Memory, Network, Disk or Virtual Switch). The list of available subsystems will depend on the selected object type.
- Metrics: defines metrics to analyze in the report. The list of available metrics will depend on the selected monitor subsystem.
- Include/Exclude: defines a list of objects that should be included in/excluded from the report scope:
- Use the Include option to define names of virtual infrastructure objects that should be included in the report. All objects not specified in the Include field will be excluded from the baseline used for data analysis.
- Use the Exclude option to define names of virtual infrastructure objects that should be excluded from the report. All objects not specified in the Exclude field will be included in the baseline used for data analysis.
|
The Include/Exclude parameters support wildcards. Search is not case sensitive. To illustrate how to use wildcard queries, consider the following example. You have selected 4 hosts as a report scope: 2 NAS servers (NASserv1, NASserv2) and 2 Active Directory servers (AD01 and AD02). If you want the report to show performance details only for the NAS servers, type nasserv* in the Include field. Alternatively, type ad* in the Exclude field. |
- Top N: defines the maximum number of VMs to display in the report.
- Show Graphics: defines whether to show charts in the report output.
- Business hours from - to: defines time of a day for which historical performance data will be used to calculate the performance trend. All data beyond this interval will be excluded from the baseline used for data analysis.