 This is an archive version of the document. To get the most up-to-date information, see the current version.
VM Configuration Chargeback
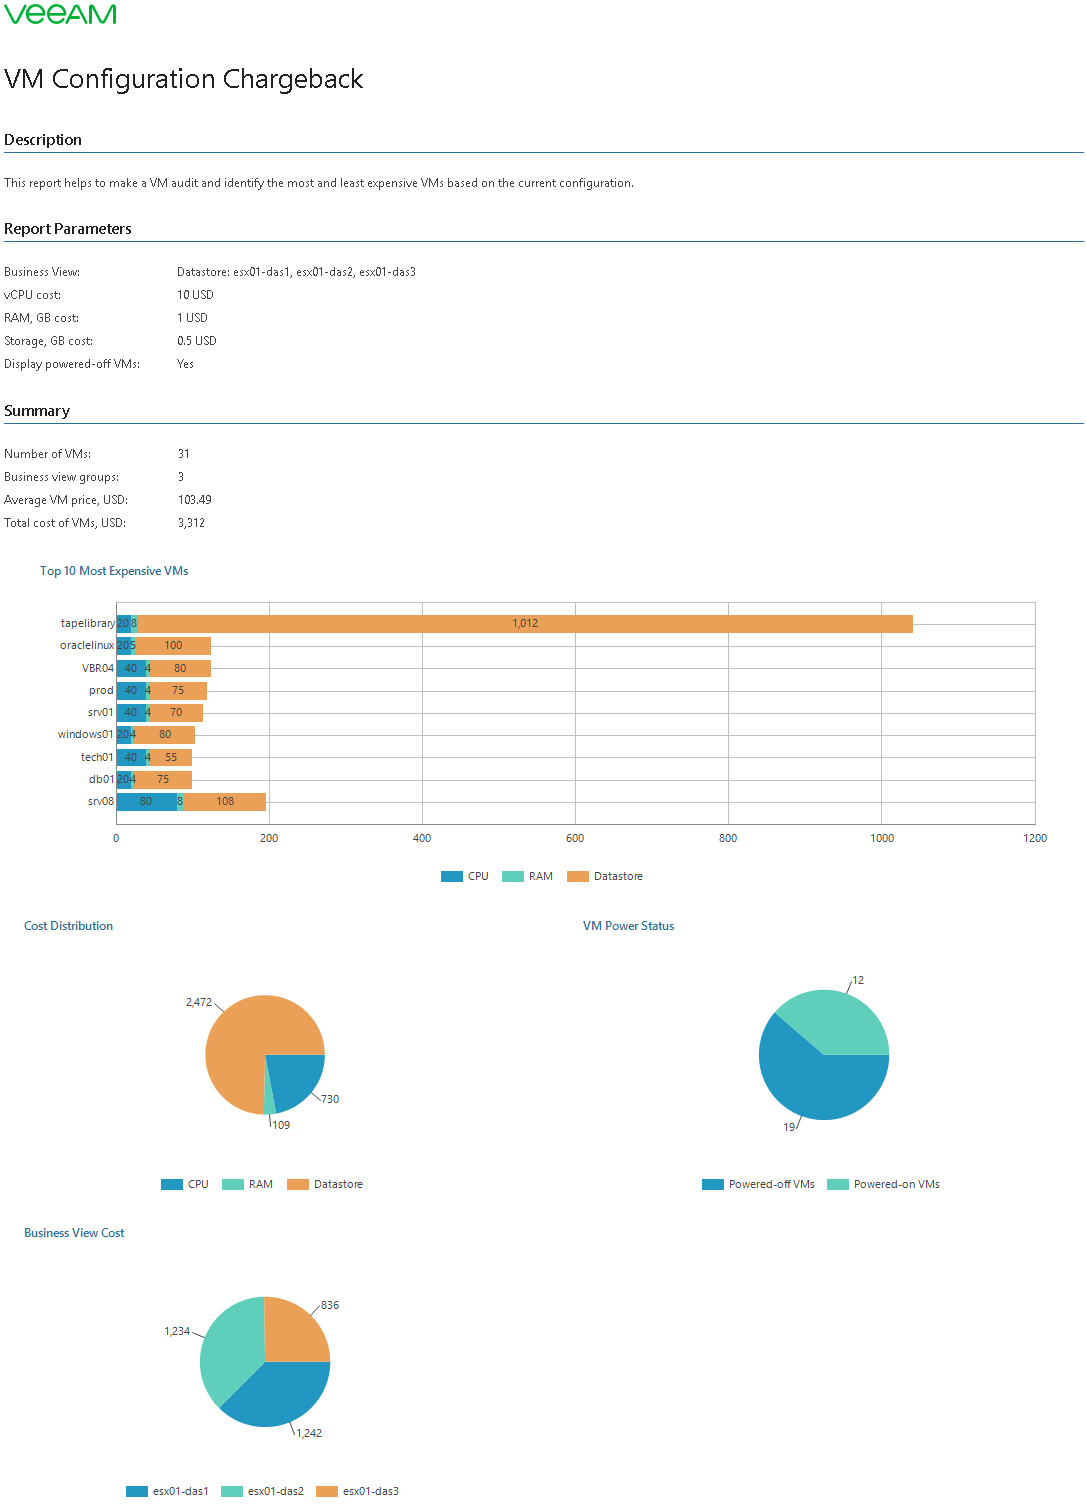
This report helps to make VM cost audit and identify the most and least expensive VMs based on the VM configuration.
The report analyzes VM cost based on flat fees for vCPU, vRAM and storage resources provisioned for a VM.
The Summary section includes the following elements:
- Details on the number of VMs, average VM cost and total cost of VMs.
- The Top 10 Most Expensive VMs section shows 10 most expensive VMs in terms of allocated resources, and provides cost of vCPU, vRAM and storage resources configured for each VM.
- The Cost Distribution chart shows the cost of hardware CPU, memory and storage resources.
- The VM Power Status chart shows the number of running and powered-off VMs. This chart is available if you choose to include powered-off VMs in the report.
- The Business View Groups Cost chart shows the cost of VMs included in Veeam ONE Business View groups. This chart is available if you include Veeam ONE Business View groups in the report scope.
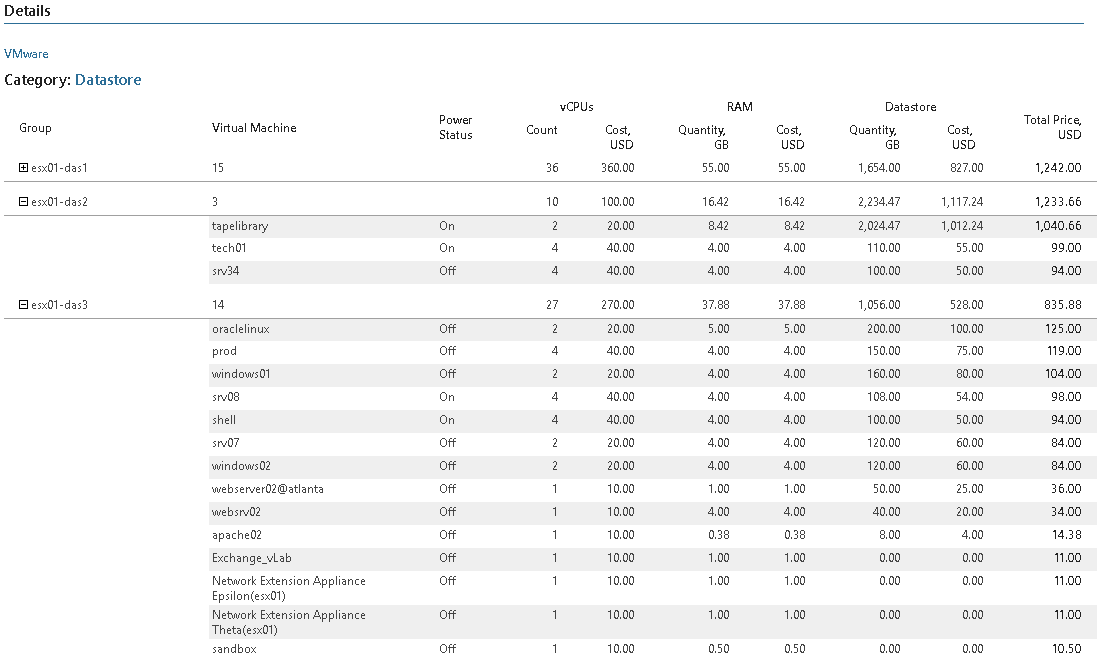
The Details table provides analysis of VM configuration cost in terms of vCPU, vRAM, storage and total cost.
Report Parameters
You can specify the following report parameters:
- Scope: defines a virtual infrastructure level and its sub-components (hosts) to analyze in the report.
- vCloud Director: defines vCloud Director components to analyze in the report.
- Business View object: defines Veeam ONE Business View groups to analyze in the report. The parameter options are limited to objects of the Virtual Machine type.
- Currency: defines a payment currency.
- vCPU cost: defines the cost of one vCPU configured for a VM, in the selected currency.
- RAM, GB cost: defines the cost of a memory GB allocated for a VM, in the selected currency.
- Storage, GB cost: defines the cost of a storage GB allocated for a VM, in the selected currency.
- Display powered-off VMs: defines whether powered-off VMs must be analyzed in the report.
Use Case
The report is intended for service providers that have flat fees on allocated virtual infrastructure resources. The report helps calculate the cost of resources that were allocated to each client or application owner, and bill tenants, clients and application owners accordingly.
IT departments can use this report to calculate the cost of provisioned VMs for application owners and business units, provided that the VM cost model in the organization is based on VM configuration.
Notes
When analyzing report data, note the following:
- For VMs with thin-provisioned or dynamic disks, the report takes into account the amount of provisioned disk space, not actually used disk space.
- For VMs with dynamic memory, the report takes into account the amount of allocated memory.

