 This is an archive version of the document. To get the most up-to-date information, see the current version.
Hyper-V VMs
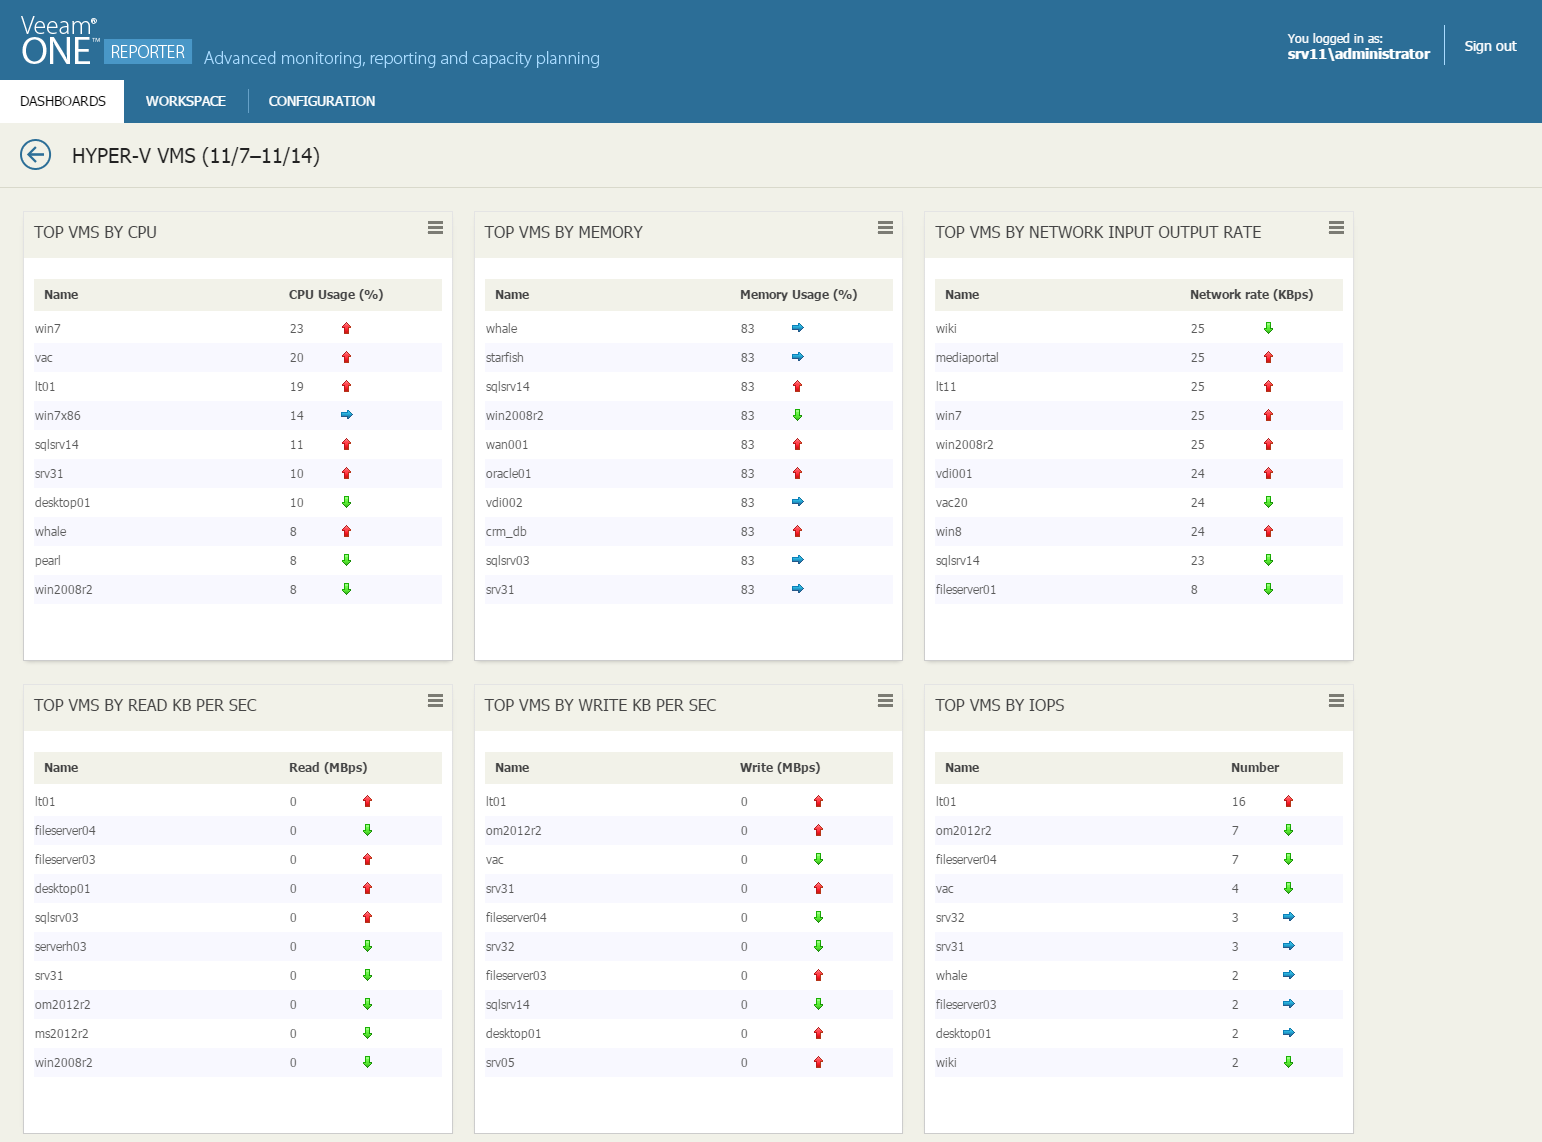
The Hyper-V VMs dashboard provides information about health and performance of VMs in the Microsoft Hyper-V infrastructure, and shows general VM statistics on CPU, memory and network usage for the past week.
Widgets Included
- Top VMs CPU
This widget displays a list of VMs with the highest average level of CPU utilization.
Arrows on the right show whether the CPU usage value has changed over the previous week*.
- Top VMs Memory
This widget displays a list of VMs with the highest average level of memory utilization. The memory utilization value is calculated as a percentage of total memory allocated for the VM.
Arrows on the right show whether the memory utilization value has changed over the previous week*.
- Top VMs Network Input Output Rate
This widget displays a list of VMs with the highest average network throughput values.
Arrows on the right show whether the throughput value has changed over the previous week*.
- Top VMs Read KB per Sec
This widget displays a list of VMs with the highest average Read metric values.
Arrows on the right show whether the average read latency value has changed over the previous week*.
- Top VMs Write KB per Sec
This widget displays a list of VMs with the highest average Write metric values.
Arrows on the right show whether the average write latency value has changed over the previous week*.
- Top VMs by IOPs
This widget displays a list of VMs with the highest average number of IOPS.
Arrows on the right show whether the number of IOPS has changed over the previous week*.
*The arrows allow you to compare the results of this week to the results of the previous week, and to track how the trend has evolved. For example, a blue arrow pointing right next to the CPU Usage value means that CPU utilization has not changed over the past week, a green arrow pointing down means that CPU utilization has decreased, while a red arrow pointing up means that CPU utilization has increased.