 This is an archive version of the document. To get the most up-to-date information, see the current version.
vApp Configuration
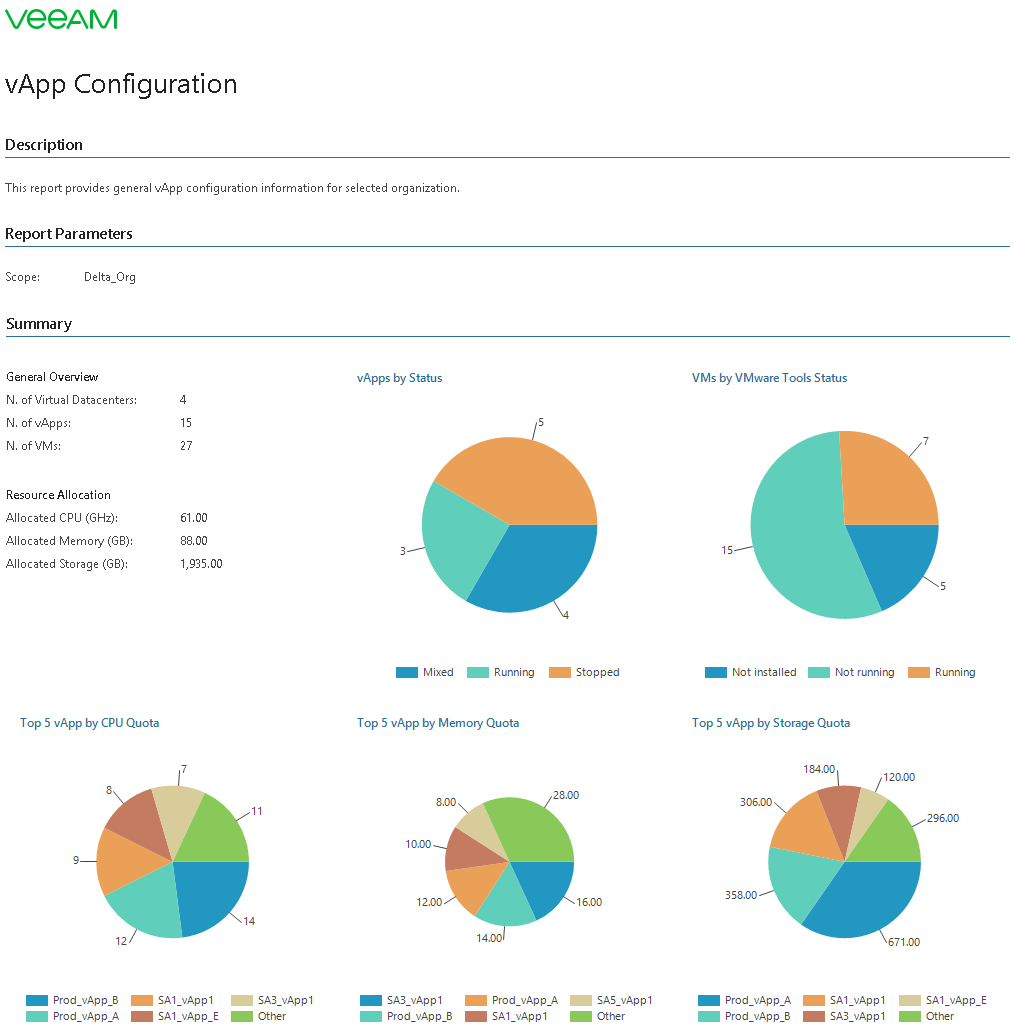
This report provides an overview of vApp configuration for a selected organization.
The report provides Top 5 charts that display vApps with the highest level of CPU, memory and storage utilization. The report also includes a chart that shows the number of powered off, powered on, resolved and suspended vApps, and a chart that shows statuses of VMware Tools installed in VMs that belong to the organization.
The Details table displays detailed information on configuration properties for each vApp created by organization users.
Use Case
This report helps vCloud administrator right-size resource provisioning to prevent resource waste and to eliminate potential performance bottlenecks.
Report Parameters
Scope: defines the organization whose vApps should be analyzed in the report.