 This is an archive version of the document. To get the most up-to-date information, see the current version.
Viewing Backup and Restore Sessions Statistics and Metrics
Each backup or restore session saves its results and metrics to the configuration database so that you can review them on demand.
In This Section
To review backup sessions, go to the History view and select either of the following nodes:
- Jobs > Backup. To see both completed and running backup sessions.
- Restore. To see Veeam Explorers restore sessions.
To stop a running session, select it in the preview pane and click Stop on the toolbar. For more information, see Managing Backup Jobs.
To review session results of only particular type, use the Success, Warnings or Errors checkboxes at the bottom.
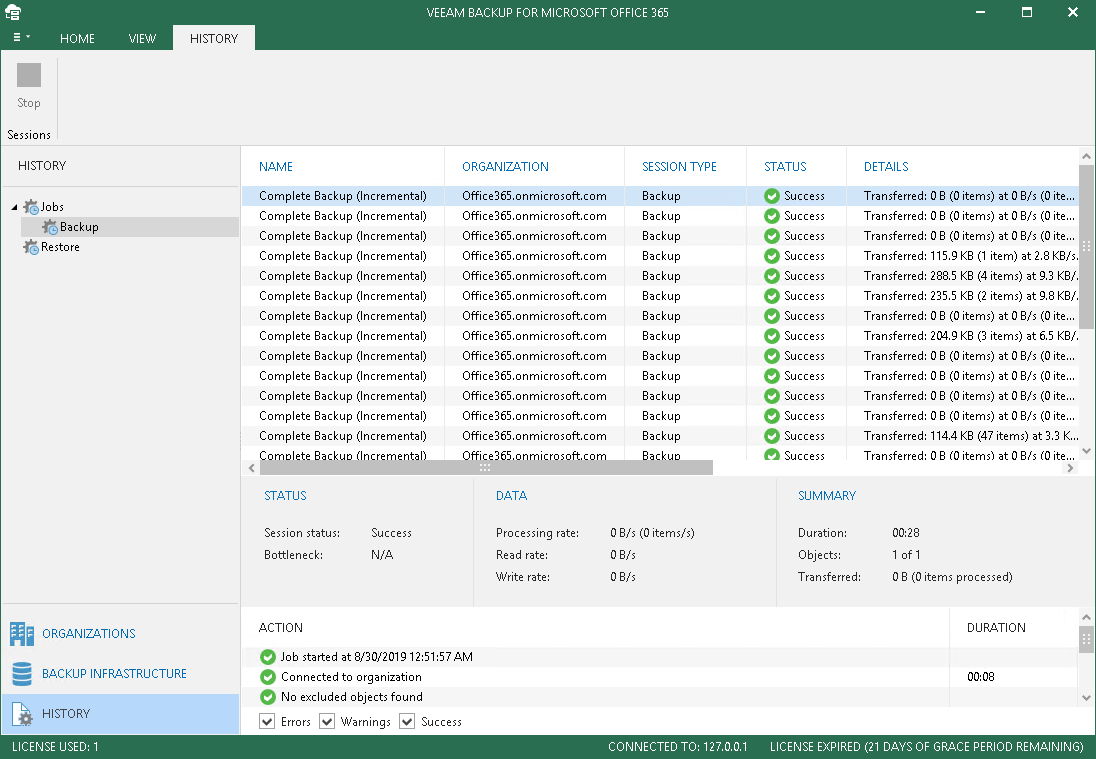
Each backup job has its own metrics that are shown during or after the execution of a job.
Metrics can be found under the preview pane on the right-hand side in the middle, as either of the following steps describes:
- Open the Organizations view and in the navigation pane, select an organization and then select a backup job.
- Open the History view and select a backup or restore session.
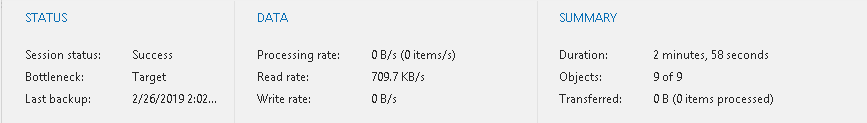
Metrics consist of the following sections:
- Status. Shows the following:
- Session Status. The current state of the selected backup job.
- Bottleneck. A bottleneck value.
This value might be: Detecting, Source, Target and N\A.
- The Detecting state is displayed when a backup job has just been started and Veeam Backup for Microsoft Office 365 has not calculated the bottleneck value yet.
- The Source state is displayed when a bottleneck occurs during download.
For example, if you have a slow connection or problems occur on the internet provider side and your connection speed drops significantly, the bottleneck value will topically be shown as Source.
- The Target state is displayed when a bottleneck occurs during writing data to disk.
For example, if you are using a hard drive that is fragmented or an old type of the hard drive, the bottleneck value will typically be shown as Target.
- The N\A state is displayed when no bottleneck occurs.
- Last Backup. Date and time of the last backup session.
- Data. Shows the following:
- Processing rate. Shows how many bytes (or items) have been downloaded.
- Read rate. The download speed.
- Write rate. The writing speed.
- Summary. Shows the following:
- Duration. The duration of a backup session.
- Objects. Shows how many objects have successfully been backed up during the session.
- Transferred. Shows how many bytes have been downloaded.