归档日志备份统计信息
You can view the statistics of the archived log backup job in the History view or in the Home view in Veeam Backup & Replication.
In the statistics window, you can examine the overall statistics for the archived log backup job, as well as view per-VM information.
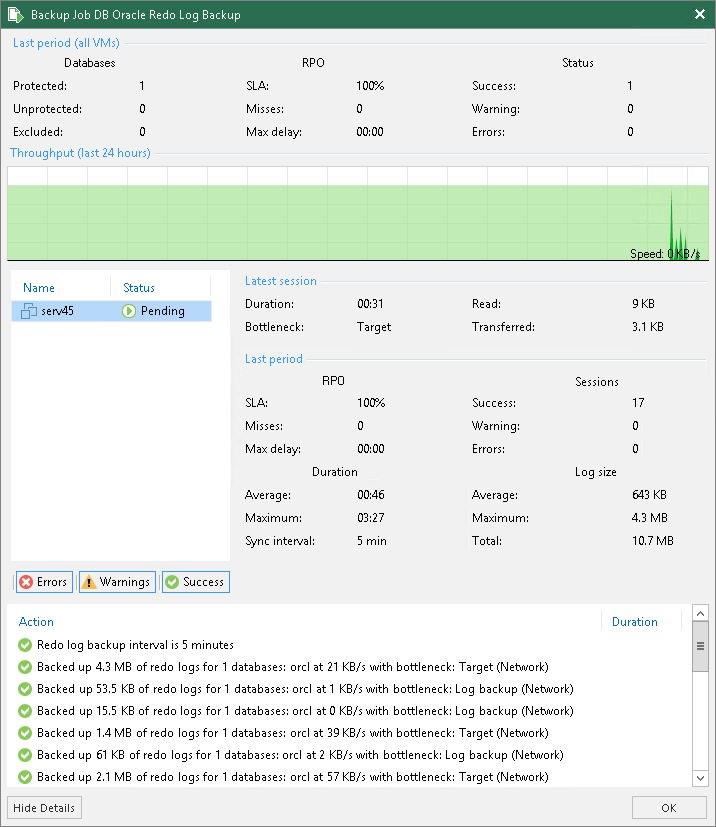
In the upper part of the statistics window, Veeam Backup & Replication displays information about the log backup job for all VMs included in the parent backup job.
The Last period (all VMs) section contains statistics data for the selected session of the backup job.
In the Databases column, you can view the following information:
- Protected — number of databases that were backed up at least once during the last session
- Unprotected — number of databases that failed to be backed up during the last session
- Excluded— databases excluded from processing. Databases may be excluded for the following reasons: ARCHIVELOG mode is turned off for the database (the database is in NOARCHIVELOG mode), database was deleted after the latest full backup, or database was added to the list of exclusions.
Note |
Unprotected databases do not comprise Excluded databases, as they have different reasons for being non-processed. See also this Veeam KB article for information on processing databases in NOARCHIVE mode. |
In the RPO column, you can view the following information:
- SLA — how many log backup intervals completed in time with successful log backup (calculated as percentage of total number of intervals).
- Misses — how many intervals failed to complete in time with successful log backup (number of intervals).
- Max delay — difference between the configured log backup interval and time actually required for log backup. If exceeded, a warning is issued.
In the Status column, the following information is displayed (per job): number of VMs processed successfully, with warnings or with errors.
The Latest session section displays the following information for the latest log processing interval for the selected VM:
- Duration — duration of log shipment from the VM guest OS to the backup repository since the current log processing interval has started
- Bottleneck — operation with the greatest duration in the last completed interval. The operation may have the following bottlenecks:
Display Name | Slowing-down Operation |
|---|---|
Log backup | Saving archived log files to a temporary location on VM guest OS (to work around, see the Veeam KB article: this Veeam KB article) |
Network | Uploading log files to the log shipping server |
Target | Saving files to the target repository |
- Read — amount of data read from the temporary folder on VM guest OS
- Transferred — amount of data transferred to the target repository
The Last period section displays the following statistics of log backups per VM for the latest session of the log backup job:
- The RPO column displays statistics on log processing interval (calculated as described above)
- The Sessions column includes statistics of log backups per VM, calculated as follows:
- Success — number of intervals when all database logs were backed up successfully
- Warning — number of sequential intervals with failed log processing (if not more than 4 intervals in a sequence)
- Errors — number of sequential intervals with failed log processing (more than 4 intervals in a sequence)
- The Duration column includes the following information:
- Average — average duration of log data transfer (through all intervals in the session)
- Maximum — maximal duration of log data transfer (through all intervals in the session)
- Sync interval — duration of periodic intervals specified for log backup in the parent job settings (default is 15 min)
- The Log size column displays the following information:
- Average — average amount of data read from the VM guest OS through all intervals
- Maximum — maximal amount of data read from the VM guest OS over all 15-min intervals
- Total — total amount of data written to the backup repository
The pane below shows all actions performed during the job run. To filter out actions with the certain status, use the Errors, Warnings and Success buttons.
Note |
Statistics on archived log processing is updated periodically, simultaneously for the VM backup job (parent) and archived log backup job (child job). |
Log Files
At each start of the Oracle backup job ('parent'), a new .VLB is created to store log backups in the repository:
- If the Use per-machine backup files option is selected for the repository, then Veeam will create a separate .VLB for each server processed by the job.
- If this option is cleared, then a single .VLB will be created for all servers processed by the job.
For example, if a job processes only one Oracle server, the repository will contain a number of .VLB files for it (a so-called chain).
As described in the section above, during database log backup ('child') job session, log archiving is performed by native means of the Oracle server. Archived logs are stored to a temporary folder on the Oracle VM guest file system. Then Veeam copies archived log to the current .VLB in the repository. When the new 'parent' job session starts, another .VLB is created, and the archived log files that appear after that will be stored there during the 'child' job session. The resulting chain of .VLBs will look like shown below, depicted for a single Oracle VM1:
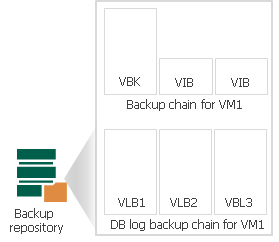
Total number of all archived logs files stored at the moment in all VLBs is reported as a number of restore points for the 'child' job that backs up database logs. So, in the example above, the log backup job for Oracle VM1 has created 8 restore points by the moment.