Data Collection
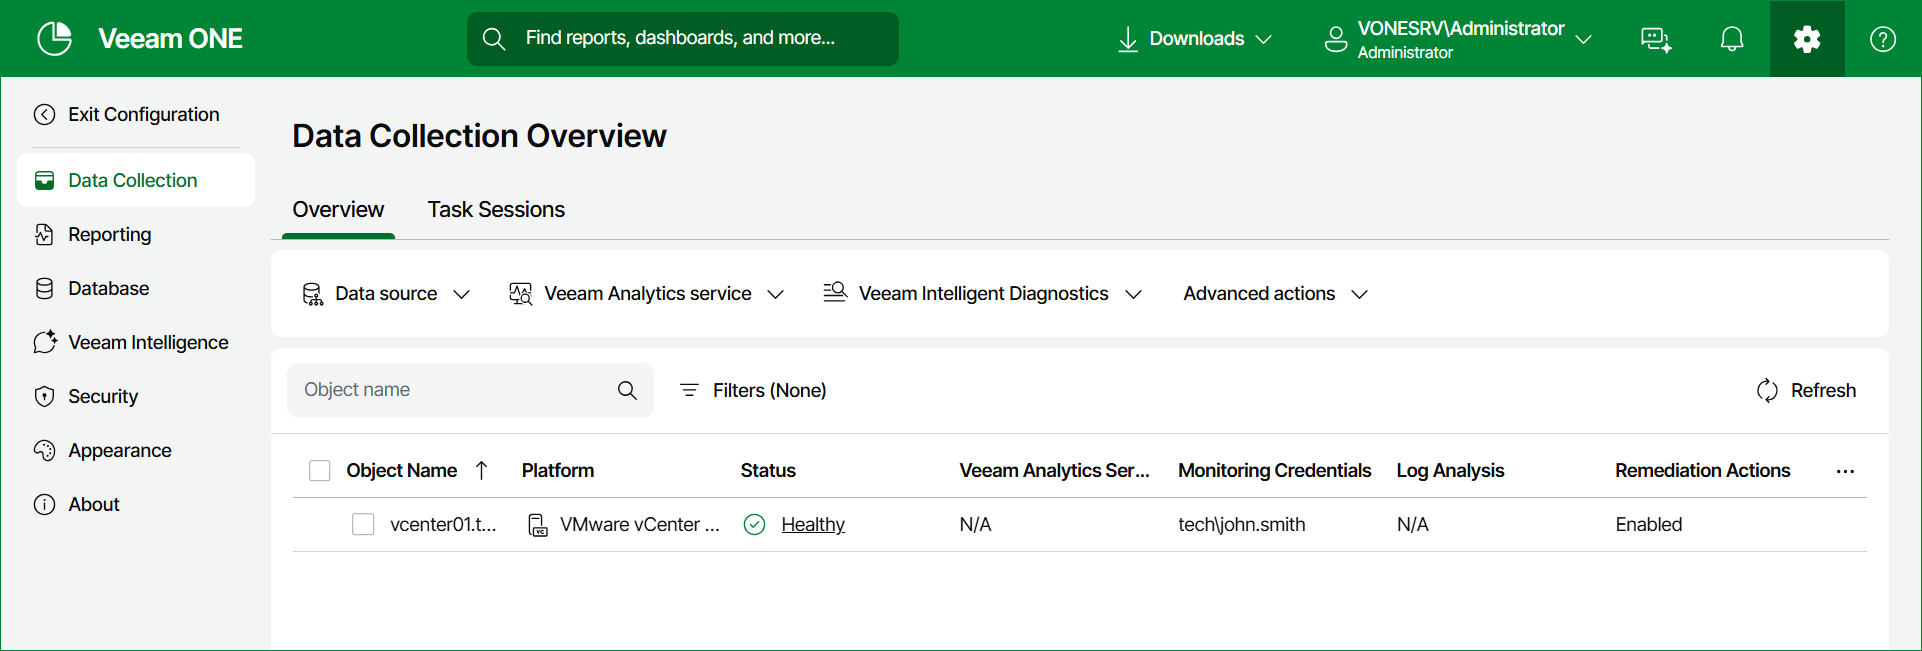
The Data Collection Overview screen shows the servers that Veeam ONE collects data from, along with the status of the latest data collection for each server.
The screen groups these servers into subtabs by infrastructure type: Veeam Backup & Replication, Veeam Backup for Microsoft 365, and Virtual Infrastructure. Each subtab shows the overall health status of its servers, based on the collection session and connection results. For Veeam Backup & Replication servers, the subtab also displays additional information based on the Veeam Analytics Service status.
For details on connecting servers, see Adding Data Source.
For each server in the list, the following details are available depending on the selected data source:
- Veeam Backup & Replication
- Object Name — the name of the connected server or data source.
- Server Type — the type of the connected server (Veeam Backup & Replication or Veeam Backup Enterprise Manager).
- Platform Type — the operating system of the server (Microsoft Windows or Linux).
- Version — the version of the connected server, including patch information.
- Port — the network port used to connect to the server.
- Status — the overall health status of the data source, based on the collection session and connection results:
- Healthy — no errors detected.
- Unhealthy — indicates a problem with data source collection or with the connection to the server. For Veeam Backup & Replication and Veeam Backup Enterprise Manager servers, this status can also mean that Veeam Analytics Service is not installed or has connection problems.
- Processing — initial data collection is running, or the data source status is being synchronized after a service restart.
- Veeam Analytics Service State — the installation state of the Veeam Analytics Service on the server (Installed or Not installed).
- Monitoring Credentials — the account used to connect to the server for monitoring and data collection.
- Log Analysis — shows whether log analysis is enabled or disabled for the server.
- Remediation Actions — shows whether remediation actions are enabled or disabled for the server.
- Log Analysis Session State — the state of the most recent log analysis session for the server.
- Analytics Integration — shows whether analytics integration is enabled for the server.
- Veeam Backup for Microsoft 365
- Object Name — the name of the connected server or data source.
- Status — the overall health status of the data source, based on the collection session and connection results:
- Healthy — no errors detected.
- Unhealthy — indicates a problem with data source collection or with the connection to the server.
- Processing — initial data collection is running, or the data source status is being synchronized after a service restart.
- Monitoring Credentials — the account used to connect to the server for monitoring and data collection.
- Version — the version of the connected server, including patch information.
- Port — the network port used to connect to the server.
- Virtual Infrastructure
- Object Name — the name of the connected server or data source.
- Platform Type — the virtualization platform of the server (vCenter Server, VMware ESXi host or Microsoft Hyper-V).
- Status — the overall health status of the data source, based on the collection session and connection results:
- Healthy — no errors detected.
- Unhealthy — indicates a problem with data source collection or with the connection to the server.
- Processing — initial data collection is running, or the data source status is being synchronized after a service restart.
- Monitoring Credentials — the account used to connect to the server for monitoring and data collection.
- Version — the version of the connected server, including patch information.
- Port — the network port used to connect to the server.
To narrow down the list, click the Filters button and select the the required analytics service state or states to display in the list. To choose what columns to show or hide, click the Show or hide columns button. To open the Task Details window for a server, click the server status.
You can also manage server connections, configure Veeam Analytics service and Veeam Intelligent Diagnostics settings, and perform Advanced actions, such as scheduling data collection or running it manually.
In This Section