 This guide is for customers who continue to use the original Veeam Data Cloud platform for Microsoft Azure until migration to the new unified experience platform is complete. If you use Veeam Data Cloud for Microsoft Azure in the unified experience platform, click here to go to the correct user guide.
Viewing Dashboard
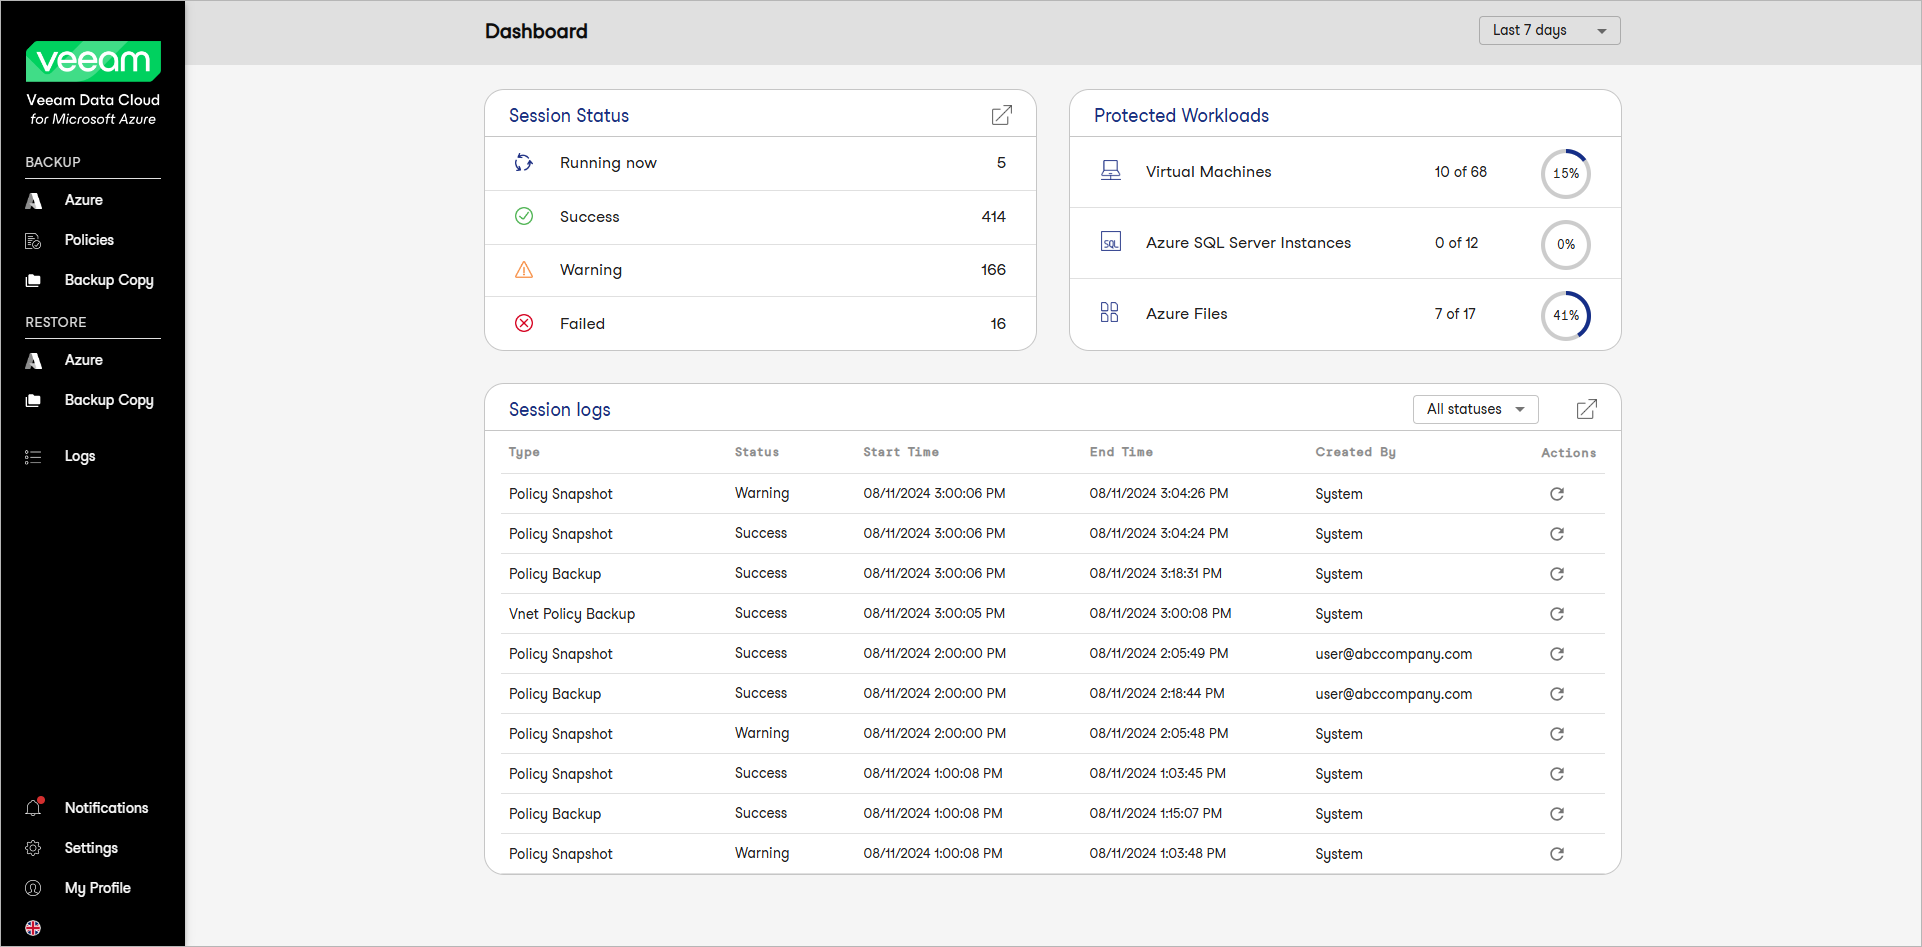
The Veeam Data Cloud for Microsoft Azure dashboard provides information on the state of backup and restore sessions and protected Microsoft Azure resources.
Accessing Dashboard
To access the Veeam Data Cloud for Microsoft Azure dashboard for the first time:
- Log in to Veeam Data Cloud for Microsoft Azure.
- Complete the onboarding steps outlined in Self-Service Onboarding.
After that, the dashboard is displayed every time you log in.
To return to the dashboard from a different page, click Veeam Data Cloud for Microsoft Azure in the header or click Dashboard in the main menu.
Dashboard Widgets
There are three widgets on the dashboard:
- The Session Status widget displays the number of all sessions that completed successfully during a specific time period, the number of sessions that completed with warnings, the number of sessions that failed, and the number of sessions that are currently running.
To get more information on sessions with a specific status, click the required widget row. In this case, the Logs tab will show the sessions that have the same status as that clicked in the widget. To learn more about the Logs tab, see Viewing Logs and Notifications.
- The Protected Workloads widget displays the number of Azure resources that got protected by Veeam Data Cloud for Microsoft Azure during a specific time period.
To get more information on specific protected resources, click the required widget row. For more information on resources, their properties and the actions you can perform for them, see Viewing Resources.
- The Session logs widget provides information on the last 10 Veeam Data Cloud for Microsoft Azure sessions, their type, status, start and end time, user who started the session and available actions.
By default, sessions in all statuses are shown. You can view sessions in the necessary status only. To do that, select a status from the drop-down list in the upper right corner of the widget.
To view the sessions logs, click the icon in the upper right corner of the widget. In this case, you will see information about all the sessions in the Logs tab. To learn more about the Logs tab, see Viewing Logs and Notifications.
By default, Veeam Data Cloud for Microsoft Azure displays information for the last 7 days. To specify another time period, select a period from the drop-down list in the upper right corner of the page.
