Capacity Planning Widget
This widget forecasts how many days remain before the level of resource utilization reaches the specified threshold.
Sample Usage
This section provides step-by-step instructions that will help you understand how to use the Capacity Planning widget. Consider the following example:
You need to analyze memory usage on hosts and make sure that the usage level will not exceed 75% within the next 30 days.
In a dashboard, click to add a new widget and follow the next steps:
- At the Template step, choose Veeam > Veeam Capacity Planning Widget.
- At the General Properties step, specify widget display name and description.
- At the Scope step, choose what infrastructure objects will be included in the widget scope:
- In the Specify a scope by selecting a group of objects or object container box, add the Veeam Hyper-V Clusters Group.
- In the Select a class of objects to calculate capacity prediction field, choose Hyper-V Host (Veeam MP).
- At the Specify forecast horizon step, specify the data collection period and forecast horizon:
- In the Make a forecast based on the performance data from the last field, enter 30 days.
- In the Specify horizon field, enter 30 days.
- At the Resources step, specify the expression that will be used for capacity planning. In the Specify a resource 1 row, enter the following expression:
- Metric: % Memory Used
- Operator: greater than
- Threshold: 75%
- Click Create.
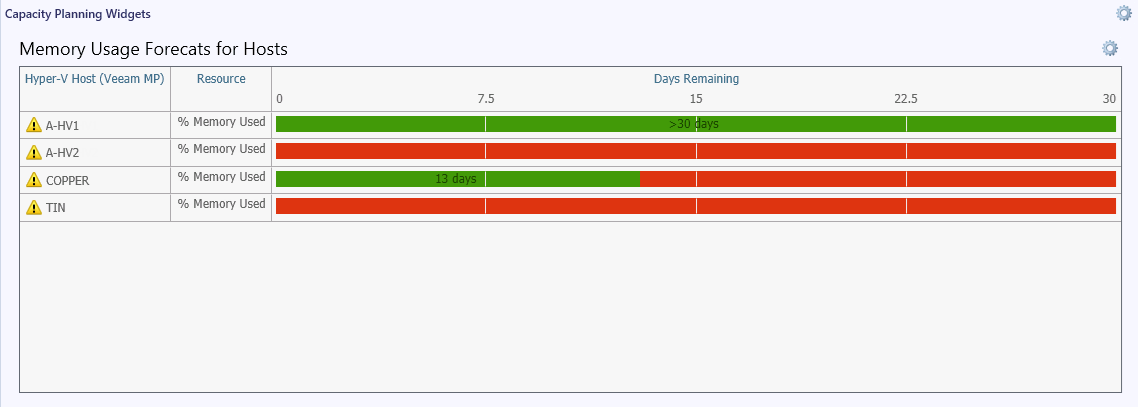
The widget will analyze host memory utilization statistics for the previous 30 days and will calculate the number of days after which the memory utilization threshold will be breached.
For each host, the widget will show a color bar:
- Days remaining before the threshold breach will be highlighted in Green
- Days after the threshold breach will be highlighted in Red.
Hosts for which the threshold has already been breached, will be represented with the red bar.
Note |
To make a forecast, historical performance data for at least 72 hours is required. The widget uses historical data for the period specified in the Make a forecast based on the performance data from the last field. If there is not enough historical data within this period (for example, there were gaps and interruptions in data collection), the widget will show the warning icon next to the object name. |
Veeam MP for Hyper-V also includes default dashboards with the preconfigured Capacity Planning widgets. For details, see Capacity Planning Dashboards.
