Report Output
The report will display a list of hosts that are running low on CPU and memory resources. For each stressed host, the report will show current host CPU configuration and summary information on the amount of total and available memory resources.
Note |
All recommendations are based on the current configuration. So, if a virtual machine has no current configuration (is turned off or decommissioned), it will not be included in the report. |
In the Stressed Hosts: Memory section, click the plus sign next to the name of a stressed host to see the list of stressed VMs, their current and recommended vRAM allocation, maximum memory pressure and maximum vRAM usage values.
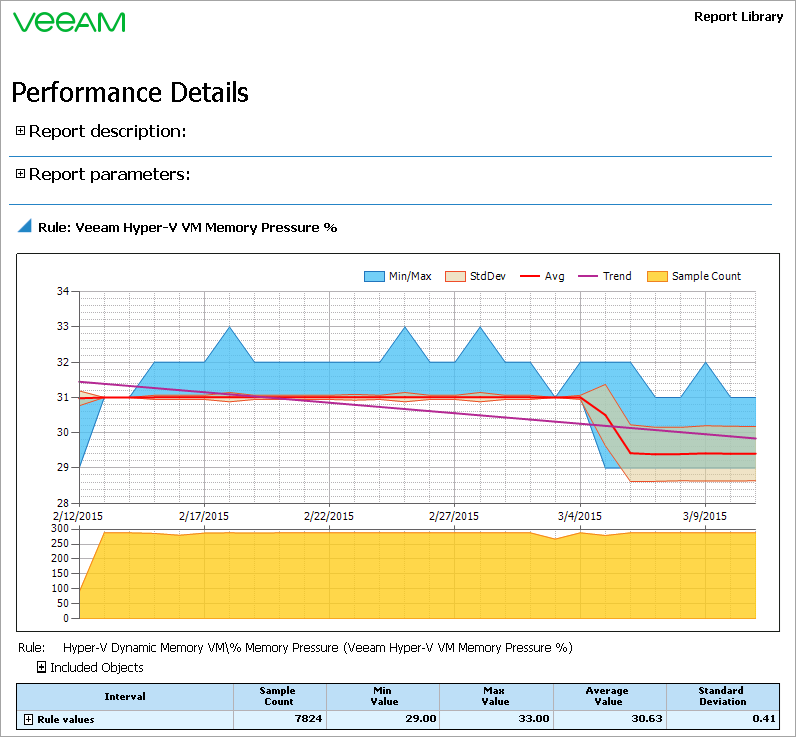
You can click the plus sign next to the name of a stressed VM to analyze how the maximum memory pressure level and the amount of available memory resources have changed for the VM during the reporting interval.

In the Stressed Hosts: CPU section, click the plus sign next to the name of a stressed host to see the list of stressed VMs, their current vCPU allocation, maximum/average CPU dispatch wait time values and the percentage of physical processor time being consumed by these VMs.
You can click the plus sign next to the name of a stressed VM to analyze how the CPU dispatch wait time (maximum and average) values have changed for the VM during the reporting interval.
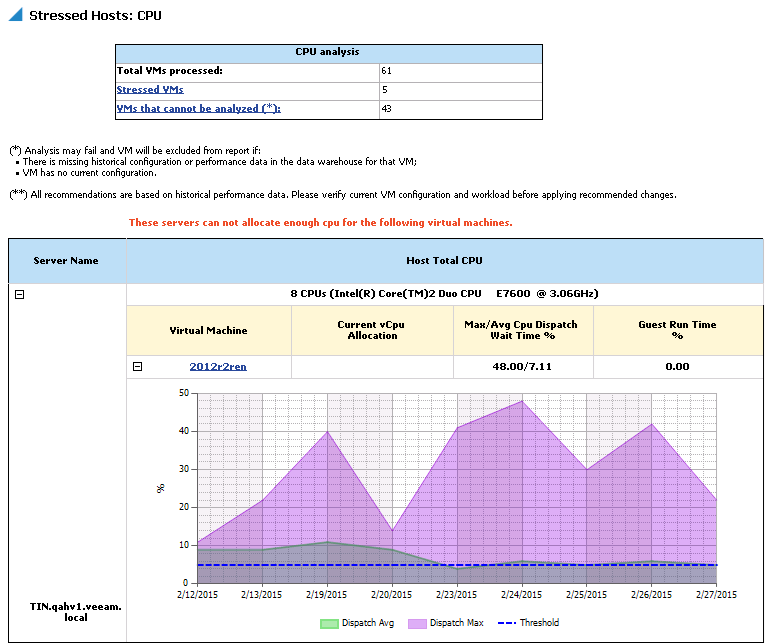
The RAM analysis and CPU analysis tables will show the total number of processed VMs, number of stressed VMs and VMs that cannot be analyzed.
You can click the name of a stressed VM in the Stressed Hosts: CPU or Stressed Hosts: Memory table, or the Stressed VMs link in the CPU analysis or RAM analysis table to drill down to performance details for these VMs.
You can click the VMs that cannot be analyzed link in the RAM analysis and CPU analysis tables to drill down to performance details for these VMs.